class: center, middle # Modeling Data  --- class: middle # Up until now, we've just looked at data <br> .pull-left-wide[ <img src="modeling_intro_files/figure-html/penguin_viz-1.png" alt="" style="display: block; margin: auto;" /> ] .pull-right-narrow[ - Is there really a linear relationship there? - Does that relationship vary by species? - Does that relationship vary by sex? - What else can I learn from this system? ] --- # How do we move beyond squinting? Is there one line here? <img src="modeling_intro_files/figure-html/pen2-1.png" alt="" style="display: block; margin: auto;" /> --- # Or three? <img src="modeling_intro_files/figure-html/pen3-1.png" alt="" style="display: block; margin: auto;" /> --- # How Do Relationships Vary by Response Variable? <img src="modeling_intro_files/figure-html/pen4-1.png" alt="" style="display: block; margin: auto;" /> --- class: center, middle # How do we learn about the world with data? --- # Building an Inferential Machine: Data in Knowledge Out! <br>  -- <br><br> .center[No.... that's not quite right] --- # Is Your Model a Golem? #### (sensu McElreath) 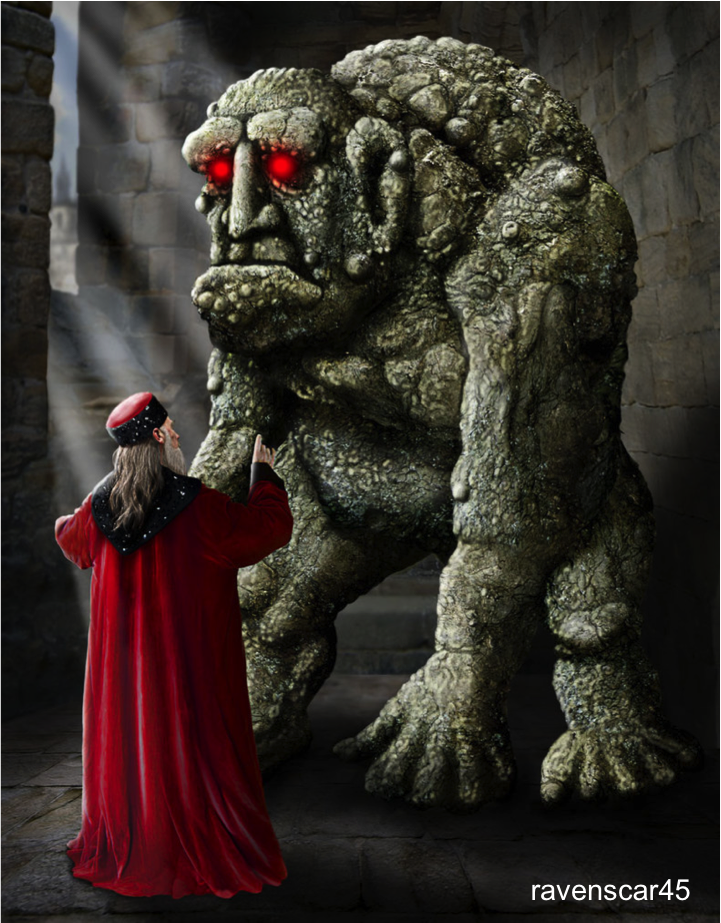 -- <br> We build a model of the world, give it instructions, and let it loose - trying not to burn down Prague. --- background-image: url("Images/modeling/midnight_train_sharon_ann_bodenus.jpg") color: white # .white[On a Midnight Train to Inference] --- # What are we doing when we model data? <br><br> 1. Start with a question we want to answer -- 2. Design a model of the part of the world we need to know about to answer the question -- 3. Acquire data appropriate to build that model -- 4. Chose an engine to fit the model -- 5. Chose an inferential framework -- 6. Use that framework to ask the fit model questions about the world --- class: center, middle # Start with a Question - What is/are Yours? --- background-image:url("Images/modeling/train_blueprints_madcom_deviantart.png") background-size: contain # Design Your Train --- # DAG - that's a good Train <img src="modeling_intro_files/figure-html/ggdag-1.png" alt="" style="display: block; margin: auto;" /> -- .large[draw your system!] --- background-image:url("Images/modeling/coastal_starlight.jpg") background-size: contain # Build Your Train with Data --- # Choose an Engine <br><br> <!-- https://github.com/emilyriederer/xaringan_columns --> ![:col_header Ordinary Least Squares, Maximum Likelihood, Bayes] ![:col_row <img src="Images/modeling/steam_train.jpg"> , <img src="Images/modeling/diesel.jpg"> , <img src="Images/modeling/bullet_train.jpg"> ] -- ![:col_list Minimizes distance between prediction and observed, Models distribution of data based on the model, Same - but incorporates prior information and gets wild ] --- # Choose Your Inferential Track 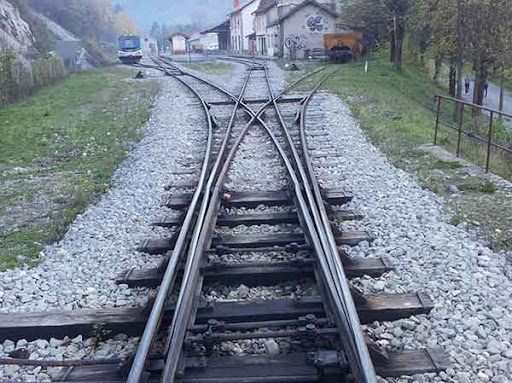 ![:col_header Hypothesis Testing, Model Comparison, Bayesian Model Implications ] -- ![:col_list Deductive Inference, Predictive Inference, Inductive Inference ] -- ![:col_list Uses probabilities of overlap with a point hypothesis, Uses tests of model performances on new data, Uses probability distributions of parameters and simulation ] --- # Look Out the Window and Ask Questions!  --- # What is the Landscape Your Train is Taking You Through?  --- # What You Want to Avoid  --- # Or Worse, Problems That You Might Not Notice  --- class: center, middle # What factors influence penguin bill depth? --- # How do I think the system works? <img src="modeling_intro_files/figure-html/penguin_dag-1.png" alt="" style="display: block; margin: auto;" /> --- # How do I think the system works? <br> `$$Depth_{ij} \sim \mathcal{N}(\hat{depth_{ij}}, \sigma^2)\\ \hat{depth}_{ij} = \alpha_j + \beta * mass_{ij}$$` -- - Beak depth of individual i from species j ... -- - is Normally distributed with some predicted depth with some error variance -- - the predicted depth is a function of a species-specific intercept - `\(\alpha_j\)` - and a coefficient `\(\beta\)` times the body mass --- # What does that math mean? `$$Depth_{ij} \sim \mathcal{N}(\hat{depth_{ij}}, \sigma^2)\\ \hat{depth}_{ij} = \alpha_j + \beta * mass_{ij}$$` <img src="modeling_intro_files/figure-html/body_plot_1-1.png" alt="" style="display: block; margin: auto;" /> --- # What does that math mean? `$$Depth_{ij} \sim \mathcal{N}(\hat{depth_{ij}}, \sigma^2)\\ \hat{depth}_{ij} = \alpha_j + \beta * mass_{ij}$$` <img src="modeling_intro_files/figure-html/body_plot_2-1.png" alt="" style="display: block; margin: auto;" /> --- # What does that math mean? `$$Depth_{ij} \sim \mathcal{N}(\hat{depth_{ij}}, \sigma^2)\\ \hat{depth}_{ij} = \alpha_j + \beta * mass_{ij}$$` <img src="modeling_intro_files/figure-html/body_plot_3-1.png" alt="" style="display: block; margin: auto;" /> --- # What does that math mean? `$$Depth_{ij} \sim \mathcal{N}(\hat{depth_{ij}}, \sigma^2)\\ \hat{depth}_{ij} = \alpha_j + \beta * mass_{ij}$$` <img src="modeling_intro_files/figure-html/show_dist-1.png" alt="" style="display: block; margin: auto;" /> --- # Chose an Engine and fit that model....  --- # What OLS is Doing <img src="modeling_intro_files/figure-html/ols-1.png" alt="" style="display: block; margin: auto;" /> --- # If we had done MLE... <img src="modeling_intro_files/figure-html/mle-1.png" alt="" style="display: block; margin: auto;" /> --- # If we had done Bayes... <img src="modeling_intro_files/figure-html/bayes-1.png" style="display: block; margin: auto;" /> --- # Make sure we our train doesn't blow up... A comparison of the distribution of observed bill depths versus those predicted by our model - one of *many* diagnostics <img src="modeling_intro_files/figure-html/assumption-1.png" alt="" style="display: block; margin: auto;" /> --- # So many ways our train could have blown up... <img src="modeling_intro_files/figure-html/performance-1.png" alt="" style="display: block; margin: auto;" /> --- # Inference  -- Oh, let's go with hypothesis testing... --- # Our first journey: what do things look like out the window? <img src="modeling_intro_files/figure-html/model_viz-1.png" alt="" style="display: block; margin: auto;" /> --- # Coming 'round the bend - do species or body mass matter? Let's look at the ratio of variation explained by each predictor versus noise, and ask, what's the probability of seeing that ratio or a more extreme ratio if that predictor actually did not affect bill depth. This is a *p-value*. -- --- # Passing the next hill - how precise are our coefficient estimates? <img src="modeling_intro_files/figure-html/plot_confidence-1.png" alt="" style="display: block; margin: auto;" /> -- We can see that there is still scatter - but can estimate that our model explains 80% of the variation in bill depth --- # One last check for the road - are species different from one another, if we held body mass constant? <img src="modeling_intro_files/figure-html/posthoc-1.png" alt="" style="display: block; margin: auto;" /> -- Note, I'm not calculating p-values, but looking at the precision of our estimates of differences to see if they overlap 0. This is still hypothesis testing - deductive inference. --- # What did we learn? - Species and body mass matter for bill depth - We have been able to estimate this relationship fairly well for the data we have - Body mass leads to deeper bills - If we lined up a penguins of the same body mass, Gentoo penguins have less deep bills - At the same mass, Adelie and Chinstrap penguins have the same bill depth