Writing Reusable Code with Functions

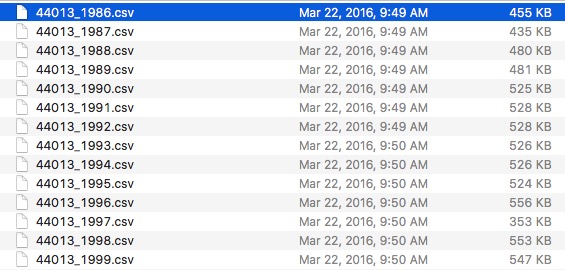
Let’s Say You Have This…
You Want To…
But There Are Problems - Changing Year Formats and names
# A tibble: 6 × 16
     YY    MM    DD    hh    WD  WSPD   GST  WVHT   DPD   APD   MWD   BAR  ATMP
  <dbl> <dbl> <dbl> <dbl> <dbl> <dbl> <dbl> <dbl> <dbl> <dbl> <dbl> <dbl> <dbl>
1    86     1     1     0   210     9    11    99    99    99   999 1009.   5.8
2    86     1     1     1   210     9    10    99    99    99   999 1009.   4.7
3    86     1     1     2   220     8    10    99    99    99   999 1009.   4
4    86     1     1     3   220     6     8    99    99    99   999 1009.   3.9
5    86     1     1     4   210     6     8    99    99    99   999 1009    3.9
6    86     1     1     5   210     6     8    99    99    99   999 1008.   3.9
# ℹ 3 more variables: WTMP <dbl>, DEWP <dbl>, VIS <dbl>
# A tibble: 6 × 16
YYYY MM DD hh WD WSPD GST WVHT DPD APD MWD BAR ATMP
<dbl> <dbl> <dbl> <dbl> <dbl> <dbl> <dbl> <dbl> <dbl> <dbl> <dbl> <dbl> <dbl>
1 1999 1 1 0 221 5.4 7.2 0.33 11.1 5.25 999 1017. -4.3
2 1999 1 1 1 218 5.6 7.3 0.31 11.1 5.51 999 1016. -4
3 1999 1 1 2 226 5.7 7 0.32 12.5 6.53 999 1016. -3.9
4 1999 1 1 3 228 5.7 7.3 0.31 11.1 6.17 999 1015. -3.9
5 1999 1 1 4 237 5.9 7.7 0.39 11.1 5.02 999 1015 -3.8
6 1999 1 1 5 235 5.7 7.5 0.42 11.1 4.81 999 1015. -3.9
# ℹ 3 more variables: WTMP <dbl>, DEWP <dbl>, VIS <dbl>Worse… nonnumeric row cruft
# A tibble: 6 × 18
  X.YY  MM    DD    hh    mm    WDIR  WSPD  GST   WVHT  DPD   APD   MWD   PRES
  <chr> <chr> <chr> <chr> <chr> <chr> <chr> <chr> <chr> <chr> <chr> <chr> <chr>
1 #yr   mo    dy    hr    mn    degT  m/s   m/s   m     sec   sec   degT  hPa
2 2012  06    30    23    50    253   3.4   4.2   0.52  9.09  5.33  86    1005.4
3 2012  07    01    00    50    198   3.5   4.1   0.53  7.69  5.41  107   1005.7
4 2012  07    01    01    50    199   4.0   4.7   0.48  10.00 5.60  102   1006.1
5 2012  07    01    02    50    218   3.9   4.4   0.45  9.09  5.20  87    1006.1
6 2012  07    01    03    50    222   4.5   4.8   0.41  7.69  4.68  100   1006.5
# ℹ 5 more variables: ATMP <chr>, WTMP <chr>, DEWP <chr>, VIS <chr>, TIDE <chr>
Solutions?
Solutions
- Write code for each individual file
- Lots of copy-paste
- Write code that row-binds all data and clean from there
- Only good once - what about next year?
- FUNCTIONS!
What is our Philosophy?
“You should consider writing a function whenever you’ve copied
and pasted a block of code more than twice”
- H. Wickham
Let’s Find the Problems!
Problems with Buoys - Each one (or two) is a function!
NA characters vary (99, 999).
Need to eliminate rows with
#yr& turn cols numericNames for year are nonstandard
- X.YY, YY, and YYYY
Some years are listed with only two digits
- Typically, but maybe not always, less than 1999
Col names are abbreviations - make it readable!
Is hourly really a good idea?
Where to Start?!
Every problem is an opportunity for a function.
With every problem, identify what you want to input as an argument, and what you want as an output.
Don’t make one function do too much! You can always chain together many functions
To start - reading in a buoy file
Let’s just write a function that will read in any of the buoys and return a nice data frame.
Let’s call it
read_buoy.But before we start….
How do I build a function?
- OK, what’s normally going to change
- The year!
- BUT - what could change under some circumstances?
- buoy number, directory, separator.
- let’s leave that for later and just
- Identify what could differ between files for just
loading
- Don’t try and do too much at once!
- Write some test code to load in one buoy NOT in a function to start
Test Code: Copy these comments and write code!
Test Code Example
# define a year
a_year <- 2013

# make a filename (could use paste0 instead of str_c)
# or glue::glue()
buoy_file <- str_c("lectures/data/buoydata/44013_", a_year, ".csv")

# read in a file
read_csv(buoy_file)
# A tibble: 8,210 × 18
X.YY MM DD hh mm WDIR WSPD GST WVHT DPD APD MWD PRES
<chr> <chr> <chr> <chr> <chr> <chr> <chr> <chr> <chr> <chr> <chr> <chr> <chr>
1 #yr mo dy hr mn degT m/s m/s m sec sec degT hPa
2 2012 12 31 23 50 234 8.5 10.2 0.42 3.33 3.14 279 1011…
3 2013 01 01 00 50 246 9.0 10.9 0.52 2.86 2.94 251 1010…
4 2013 01 01 01 50 243 7.3 9.4 0.50 3.33 3.05 237 1010…
5 2013 01 01 02 50 252 10.5 12.4 0.50 3.03 2.99 244 1009…
6 2013 01 01 03 50 256 10.9 13.0 0.65 3.70 3.28 265 1008…
7 2013 01 01 04 50 254 11.6 13.2 0.72 3.70 3.33 255 1007…
8 2013 01 01 05 50 244 10.8 12.7 0.84 4.00 3.54 260 1006…
9 2013 01 01 06 50 241 10.5 12.4 0.74 3.85 3.34 259 1006…
10 2013 01 01 07 50 237 9.7 11.9 0.67 3.70 3.17 257 1006…
# ℹ 8,200 more rows
# ℹ 5 more variables: ATMP <chr>, WTMP <chr>, DEWP <chr>, VIS <chr>, TIDE <chr>Unit Testing
Take the smallest piece of code in an application, and make a test to ensure if works properly
Unit test for 1993 - OK on type
Unit test for 1993 - bad on range!
       YY           MM               DD              hh             WD
 Min.   :93   Min.   : 1.000   Min.   : 1.00   Min.   : 0.0   Min.   :  0.0
 1st Qu.:93   1st Qu.: 4.000   1st Qu.: 8.00   1st Qu.: 5.0   1st Qu.:124.0
 Median :93   Median : 7.000   Median :16.00   Median :11.0   Median :209.0
 Mean   :93   Mean   : 6.538   Mean   :15.72   Mean   :11.5   Mean   :195.3
 3rd Qu.:93   3rd Qu.:10.000   3rd Qu.:23.00   3rd Qu.:18.0   3rd Qu.:278.0
 Max.   :93   Max.   :12.000   Max.   :31.00   Max.   :23.0   Max.   :999.0
      WSPD             GST              WVHT             DPD
 Min.   : 0.000   Min.   : 0.000   Min.   : 0.000   Min.   : 0.000
 1st Qu.: 4.000   1st Qu.: 4.700   1st Qu.: 0.400   1st Qu.: 5.900
 Median : 5.900   Median : 7.000   Median : 0.600   Median : 8.300
 Mean   : 6.382   Mean   : 8.138   Mean   : 2.247   Mean   : 9.351
 3rd Qu.: 8.200   3rd Qu.:10.000   3rd Qu.: 1.000   3rd Qu.:10.000
 Max.   :99.000   Max.   :99.000   Max.   :99.000   Max.   :99.000
      APD              MWD           BAR              ATMP
 Min.   : 0.000   Min.   :  0   Min.   : 964.6   Min.   :-14.00
 1st Qu.: 4.500   1st Qu.:999   1st Qu.:1010.7   1st Qu.:  2.80
 Median : 5.600   Median :999   Median :1016.4   Median :  9.50
 Mean   : 7.042   Mean   :792   Mean   :1035.0   Mean   : 10.58
 3rd Qu.: 6.800   3rd Qu.:999   3rd Qu.:1022.5   3rd Qu.: 16.50
 Max.   :99.000   Max.   :999   Max.   :9999.0   Max.   :999.00
      WTMP             DEWP          VIS
 Min.   :  0.80   Min.   :999   Min.   : 0.00
 1st Qu.:  4.00   1st Qu.:999   1st Qu.:99.00
 Median :  9.50   Median :999   Median :99.00
 Mean   : 11.67   Mean   :999   Mean   :78.51
 3rd Qu.: 14.10   3rd Qu.:999   3rd Qu.:99.00
Max. :999.00 Max. :999 Max. :99.00 More testing with Small Changes - YES!
       YY           MM               DD              hh             WD
 Min.   :93   Min.   : 1.000   Min.   : 1.00   Min.   : 0.0   Min.   :  0.0
 1st Qu.:93   1st Qu.: 4.000   1st Qu.: 8.00   1st Qu.: 5.0   1st Qu.:124.0
 Median :93   Median : 7.000   Median :16.00   Median :11.0   Median :209.0
 Mean   :93   Mean   : 6.538   Mean   :15.72   Mean   :11.5   Mean   :195.1
 3rd Qu.:93   3rd Qu.:10.000   3rd Qu.:23.00   3rd Qu.:18.0   3rd Qu.:278.0
 Max.   :93   Max.   :12.000   Max.   :31.00   Max.   :23.0   Max.   :360.0
                                                              NA's   :20
      WSPD            GST              WVHT             DPD
 Min.   : 0.00   Min.   : 0.000   Min.   :0.0000   Min.   : 0.000
 1st Qu.: 4.00   1st Qu.: 4.700   1st Qu.:0.4000   1st Qu.: 5.900
 Median : 5.90   Median : 7.000   Median :0.6000   Median : 8.300
 Mean   : 6.34   Mean   : 7.739   Mean   :0.8358   Mean   : 8.043
 3rd Qu.: 8.20   3rd Qu.: 9.900   3rd Qu.:1.0000   3rd Qu.:10.000
 Max.   :25.70   Max.   :32.400   Max.   :6.1000   Max.   :16.700
 NA's   :4       NA's   :38       NA's   :125      NA's   :125
      APD            MWD             BAR              ATMP
 Min.   : 0.0   Min.   :  0.0   Min.   : 964.6   Min.   :-14.000
 1st Qu.: 4.5   1st Qu.: 73.0   1st Qu.:1010.6   1st Qu.:  2.800
 Median : 5.6   Median : 91.0   Median :1016.4   Median :  9.500
 Mean   : 5.7   Mean   :117.6   Mean   :1016.4   Mean   :  9.211
 3rd Qu.: 6.7   3rd Qu.:111.0   3rd Qu.:1022.4   3rd Qu.: 16.500
 Max.   :11.8   Max.   :358.0   Max.   :1044.5   Max.   : 31.900
 NA's   :125    NA's   :6677    NA's   :20       NA's   :12
      WTMP          DEWP              VIS
 Min.   : 0.800   Mode:logical   Min.   : 0.00
 1st Qu.: 4.000   NA's:8693      1st Qu.: 7.30
 Median : 9.400                  Median : 9.10
 Mean   : 9.503                  Mean   :11.74
 3rd Qu.:14.100                  3rd Qu.:11.00
 Max.   :22.000                  Max.   :35.80
NA's :19 NA's :6652 Make this a Function by making a_year an argument and adding a return!
#define a year
a_year <- 2013

#make a filename
buoy_file <- str_c("lectures/data/buoydata/44013_", a_year, ".csv")

# read in a file
read_csv(buoy_file, na = c("99", "999", "9999"))
Also, get a little fancier and add a buoy_number and
buoy_dir argument with sensible defaults - you’ve got
this!
One Reading Function
Problems with Buoys - Each one (or two) is a function!
NA characters vary (99, 999).Need to eliminate rows with
#yr& turn cols numericNames for year are nonstandard
- X.YY, YY, and YYYY
Some years are listed with only two digits
- Typically, but maybe not always, less than 1999
Col names are abbreviations - make it readable!
Is hourly really a good idea?
Problem 2: Extra Rows and Characters
# A tibble: 6 × 18
  X.YY  MM    DD    hh    mm    WDIR  WSPD  GST   WVHT  DPD   APD   MWD   PRES
  <chr> <chr> <chr> <chr> <chr> <chr> <chr> <chr> <chr> <chr> <chr> <chr> <chr>
1 #yr   mo    dy    hr    mn    degT  m/s   m/s   m     sec   sec   degT  hPa
2 2012  12    31    23    50    234   8.5   10.2  0.42  3.33  3.14  279   1011.6
3 2013  01    01    00    50    246   9.0   10.9  0.52  2.86  2.94  251   1010.8
4 2013  01    01    01    50    243   7.3   9.4   0.50  3.33  3.05  237   1010.0
5 2013  01    01    02    50    252   10.5  12.4  0.50  3.03  2.99  244   1009.0
6 2013  01    01    03    50    256   10.9  13.0  0.65  3.70  3.28  265   1008.1
# ℹ 5 more variables: ATMP <chr>, WTMP <chr>, DEWP <chr>, VIS <chr>, TIDE <chr>
Fix it with a function!
Work with a partner and write a function that will strip non-numeric rows from a buoy data frame and turn character cols numeric
Start with a single test case, and apply unit tests.
- hint:
mutate(across(.cols = everything(), .fns = as.numeric))
- hint: what is the same and what is different across files?
- hint:
Once it works broadly, turn it into a function so that we can…
My test code outline (there are many solutions)
Alternate Solution if we Don’t Care About NAs
My test code
# get some buoy data
dat <- read_buoy(2013)
# Turn everything numeric, as then some rows will be all NA
dat <- dat |>
mutate(across(.cols = everything(),
.fns = as.numeric))
# Remove rows where month is NA, as the year col name changes
dat <- dat |>
filter(!is.na(MM))
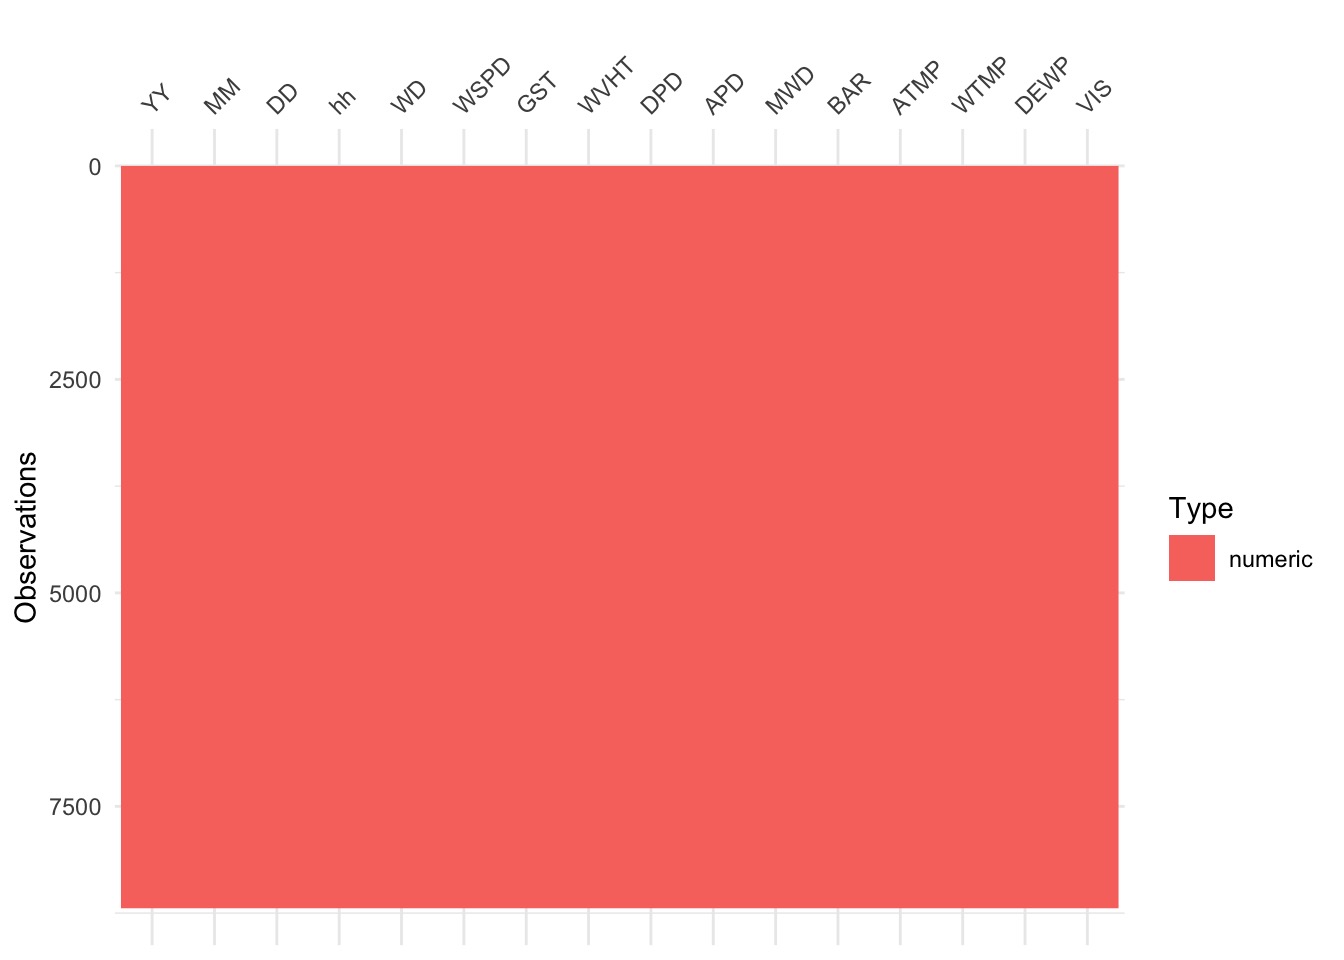
# TESTS
visdat::vis_dat(dat)
summary(dat)Turn it into a function
Does It Blend?
# A tibble: 6 × 18
   X.YY    MM    DD    hh    mm  WDIR  WSPD   GST  WVHT   DPD   APD   MWD  PRES
  <dbl> <dbl> <dbl> <dbl> <dbl> <dbl> <dbl> <dbl> <dbl> <dbl> <dbl> <dbl> <dbl>
1  2012    12    31    23    50   234   8.5  10.2  0.42  3.33  3.14   279 1012.
2  2013     1     1     0    50   246   9    10.9  0.52  2.86  2.94   251 1011.
3  2013     1     1     1    50   243   7.3   9.4  0.5   3.33  3.05   237 1010
4  2013     1     1     2    50   252  10.5  12.4  0.5   3.03  2.99   244 1009
5  2013     1     1     3    50   256  10.9  13    0.65  3.7   3.28   265 1008.
6  2013     1     1     4    50   254  11.6  13.2  0.72  3.7   3.33   255 1007.
# ℹ 5 more variables: ATMP <dbl>, WTMP <dbl>, DEWP <dbl>, VIS <dbl>, TIDE <dbl>
Problems with Buoys - Each one (or two) is a function!
NA characters vary (99, 999).Need to eliminate rows with#yr& turn cols numericNames for year are nonstandard
- X.YY, YY, and YYYY
Some years are listed with only two digits
- Typically, but maybe not always, less than 1999
Col names are abbreviations - make it readable!
Is hourly really a good idea?
That Year Problem
# A tibble: 6 × 16
     YY    MM    DD    hh    WD  WSPD   GST  WVHT   DPD   APD   MWD   BAR  ATMP
  <dbl> <dbl> <dbl> <dbl> <dbl> <dbl> <dbl> <dbl> <dbl> <dbl> <dbl> <dbl> <dbl>
1    86     1     1     0   210     9    11    NA    NA    NA    NA 1009.   5.8
2    86     1     1     1   210     9    10    NA    NA    NA    NA 1009.   4.7
3    86     1     1     2   220     8    10    NA    NA    NA    NA 1009.   4
4    86     1     1     3   220     6     8    NA    NA    NA    NA 1009.   3.9
5    86     1     1     4   210     6     8    NA    NA    NA    NA 1009    3.9
6    86     1     1     5   210     6     8    NA    NA    NA    NA 1008.   3.9
# ℹ 3 more variables: WTMP <dbl>, DEWP <dbl>, VIS <dbl>
# A tibble: 6 × 16
YYYY MM DD hh WD WSPD GST WVHT DPD APD MWD BAR ATMP
<dbl> <dbl> <dbl> <dbl> <dbl> <dbl> <dbl> <dbl> <dbl> <dbl> <dbl> <dbl> <dbl>
1 1999 1 1 0 221 5.4 7.2 0.33 11.1 5.25 NA 1017. -4.3
2 1999 1 1 1 218 5.6 7.3 0.31 11.1 5.51 NA 1016. -4
3 1999 1 1 2 226 5.7 7 0.32 12.5 6.53 NA 1016. -3.9
4 1999 1 1 3 228 5.7 7.3 0.31 11.1 6.17 NA 1015. -3.9
5 1999 1 1 4 237 5.9 7.7 0.39 11.1 5.02 NA 1015 -3.8
6 1999 1 1 5 235 5.7 7.5 0.42 11.1 4.81 NA 1015. -3.9
# ℹ 3 more variables: WTMP <dbl>, DEWP <dbl>, VIS <dbl>That Year Problem
# A tibble: 6 × 16
     YY    MM    DD    hh    WD  WSPD   GST  WVHT   DPD   APD   MWD   BAR  ATMP
  <dbl> <dbl> <dbl> <dbl> <dbl> <dbl> <dbl> <dbl> <dbl> <dbl> <dbl> <dbl> <dbl>
1    86     1     1     0   210     9    11    NA    NA    NA    NA 1009.   5.8
2    86     1     1     1   210     9    10    NA    NA    NA    NA 1009.   4.7
3    86     1     1     2   220     8    10    NA    NA    NA    NA 1009.   4
4    86     1     1     3   220     6     8    NA    NA    NA    NA 1009.   3.9
5    86     1     1     4   210     6     8    NA    NA    NA    NA 1009    3.9
6    86     1     1     5   210     6     8    NA    NA    NA    NA 1008.   3.9
# ℹ 3 more variables: WTMP <dbl>, DEWP <dbl>, VIS <dbl>
# A tibble: 6 × 18
X.YY MM DD hh mm WDIR WSPD GST WVHT DPD APD MWD PRES
<dbl> <dbl> <dbl> <dbl> <dbl> <dbl> <dbl> <dbl> <dbl> <dbl> <dbl> <dbl> <dbl>
1 2012 6 30 23 50 253 3.4 4.2 0.52 9.09 5.33 86 1005.
2 2012 7 1 0 50 198 3.5 4.1 0.53 7.69 5.41 107 1006.
3 2012 7 1 1 50 199 4 4.7 0.48 10 5.6 102 1006.
4 2012 7 1 2 50 218 3.9 4.4 0.45 9.09 5.2 87 1006.
5 2012 7 1 3 50 222 4.5 4.8 0.41 7.69 4.68 100 1006.
6 2012 7 1 4 50 231 3.4 3.8 0.4 9.09 5.24 82 1006.
# ℹ 5 more variables: ATMP <dbl>, WTMP <dbl>, DEWP <dbl>, VIS <dbl>, TIDE <dbl>Fix two problems with 1 function!
Work with a partner and write a function that will:
- make the year column always be YYYY
- make the year column be a 4 digit year (e.g. 98 = 1998)
- hint: this is a good order to solve in
- hint: regexp withnames()orrename_with()are helpfulTest & once it works broadly, turn it into a function so that we can…
My test code
My alternate code
# get buoy data
dat <- read_buoy(1986)|> fix_bad_buoy_rows()

# use regexp to fix year column name
names(dat) <- str_replace( names(dat),
                           pattern = "X\\.YY",
                           replace = "YYYY")

names(dat) <- str_replace( names(dat),
                           pattern = "^YY$",
                           replace = "YYYY")


# if a year is < 100, add 1900 to it
dat <- dat |>
  mutate(YYYY = ifelse(YYYY < 100, YYYY+1900, YYYY))

# TEST
range(dat$YYYY)
Make it into a function
Does It Blend?
Does It Blend?
Problems with Buoys - Each one (or two) is a function!
NA characters vary (99, 999).Need to eliminate rows with#yr& turn cols numericNames for year are nonstandardX.YY, YY, and YYYY
Some years are listed with only two digitsTypically, but maybe not always, less than 1999
Col names are abbreviations - make it readable!
Is hourly really a good idea?
Before We Move Forward…
What is this?
Year can still change - it’s almost like we have another function in the making composed of modules…. this is….
Modular Programming

Wait, what is this modular madness?
Our code is composed of modular pieces
This means each modular function can be used in other contexts
- Enhances code flexibility and future reuse
It also means it is easier to find where our code has gone wrong
- Easier to test and debug
AND - we don’t get lost writing one honking single function
From Pipelines to Wrapper Function
A Cleaner Wrapper
Backwards Approach to Writing Modular Code
Analyze the steps of your task.
Break it down into pieces.
Write one function per piece.
Chain pieces together in a pipeline.
Turn pipeline into a wrapper function!
Or - Thinking Forwards for Writing Modular Code
Start with a wrapper
- Write out the steps of what you want to do in comments
- Pair those with functions using “snake case”
clean_data
- Use
|>for efficiency/readability!
- Write out the steps of what you want to do in comments
Write the subfunctions
- Repeat the toplevel comments anf functions
Continue until you have the lowest level atomized functions
Test THOSE functions. Then test up the chain….
Why do this
Reusable modules in other context.
Can unit test elements of the wrapper function
Easier to debug!
Can solve problems forwards or backwards!
Reality Check
Yes, sometimes you will write long functions - as long
as they are simple and readable, meh
Final Exercises - do 1, and then make wrappers in 2 and 3 with MINIMAL effort
Write a function that will get daily summaries of wave height and temperature only
- Make the returned column names for all values nice and
readable
- use
paste()andas.Date()to make a Date column after summarize
- Make the returned column names for all values nice and
readable
Do the same, but monthly…
Do the same, but anually….