GIS and R
Trends only tell us so much

Trends only tell us so much
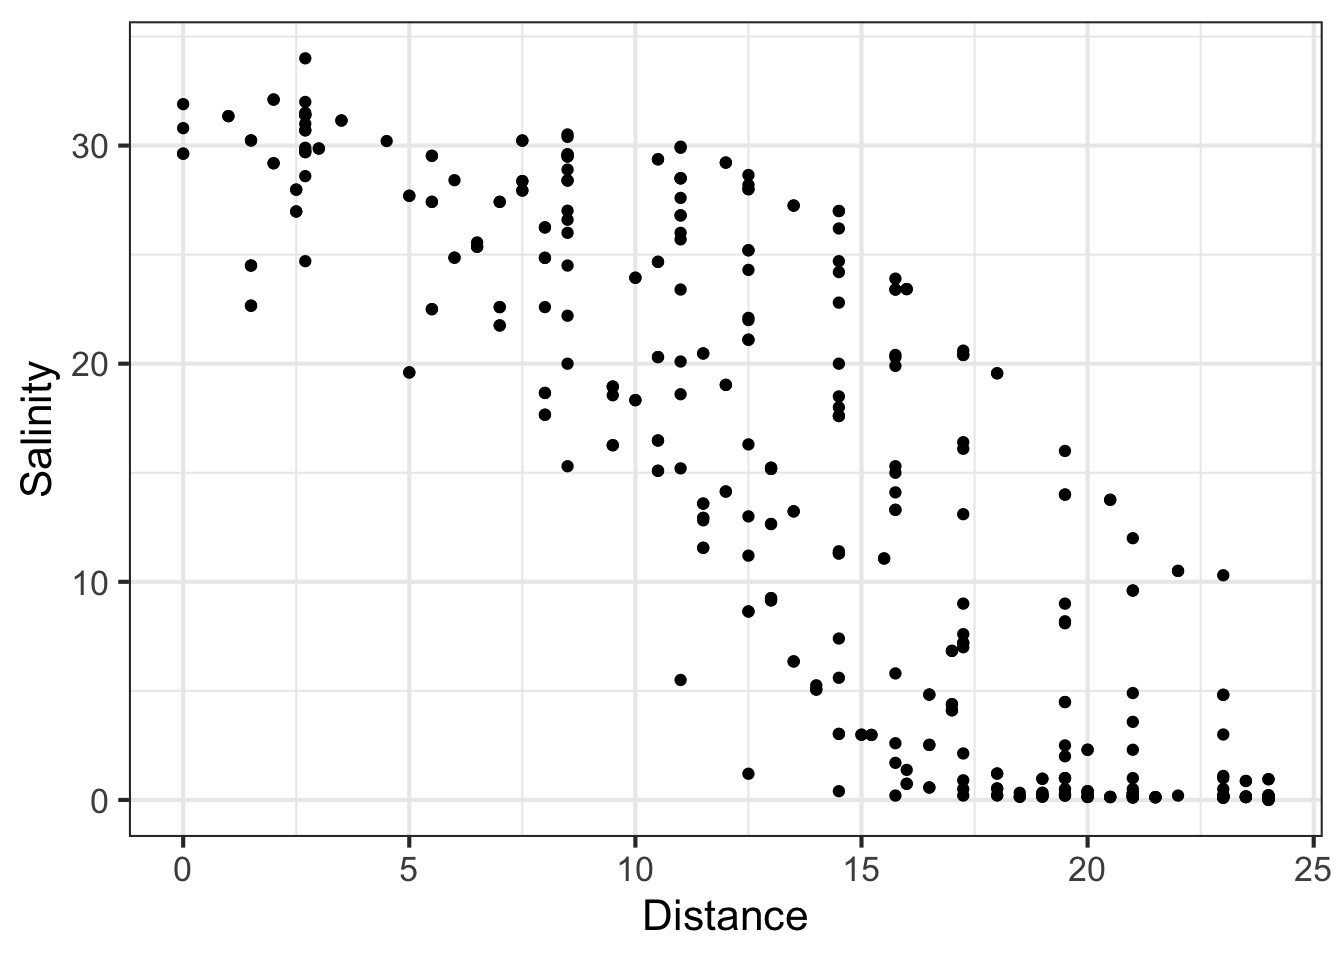
You’re starting to see something spatial…

Often within Relationships is a Pattern
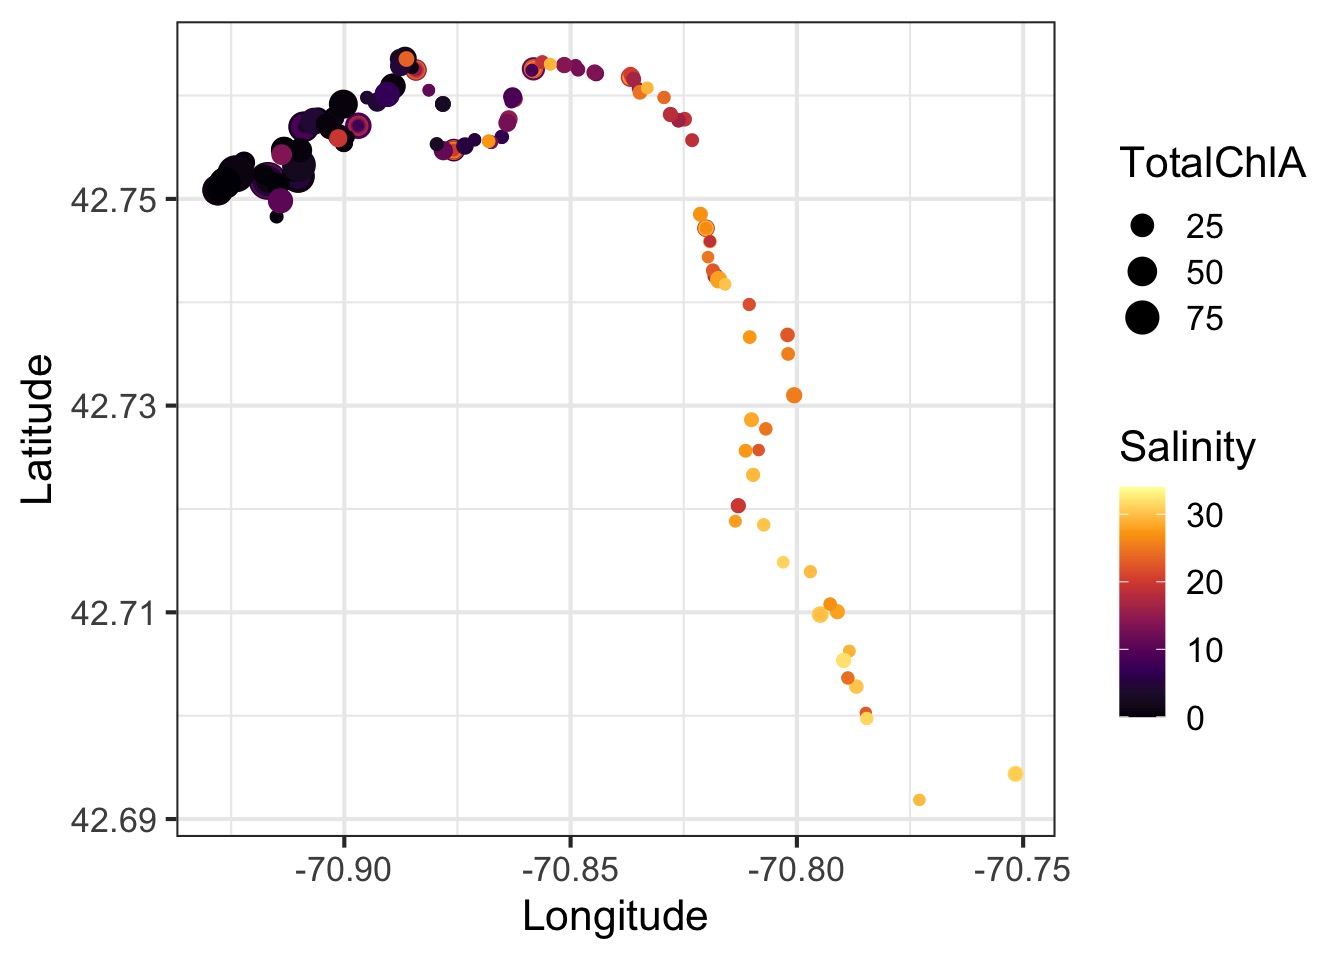
What do you learn from this that is new?
Context!
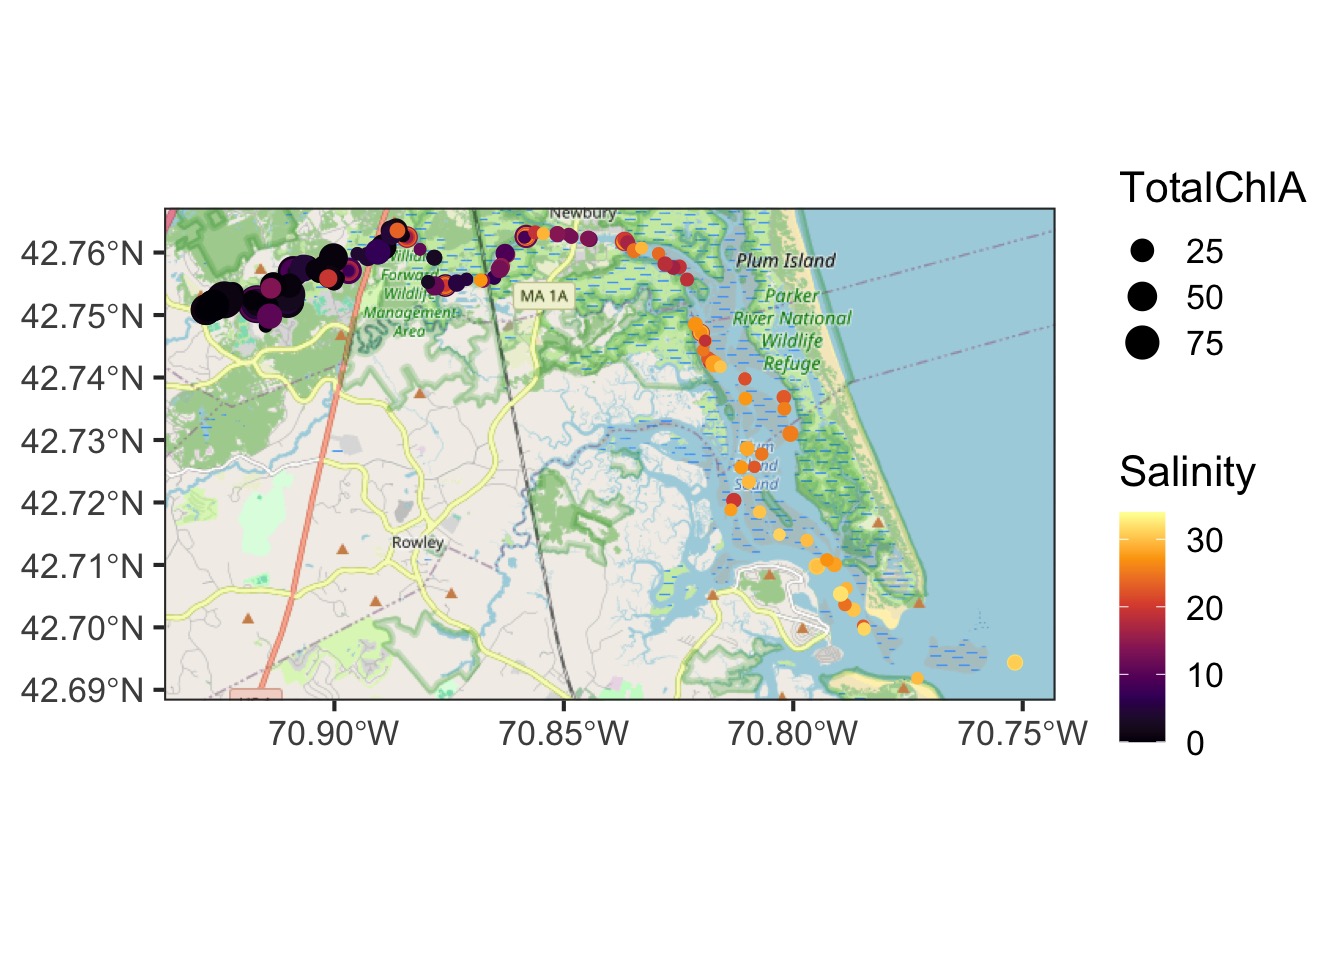
What do you learn from this that is new?
What does this tell you that a bar plot would not?
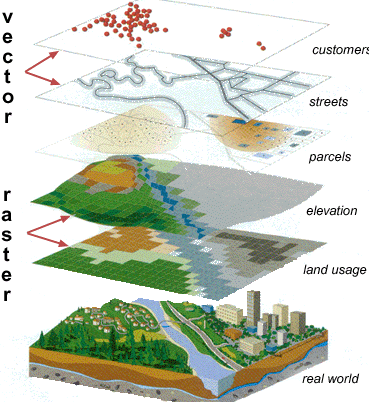
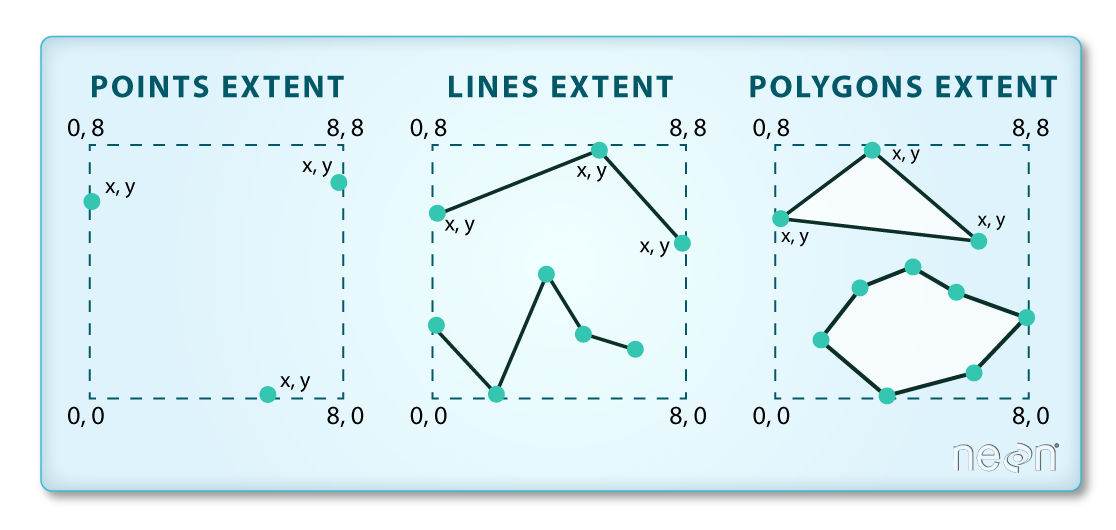
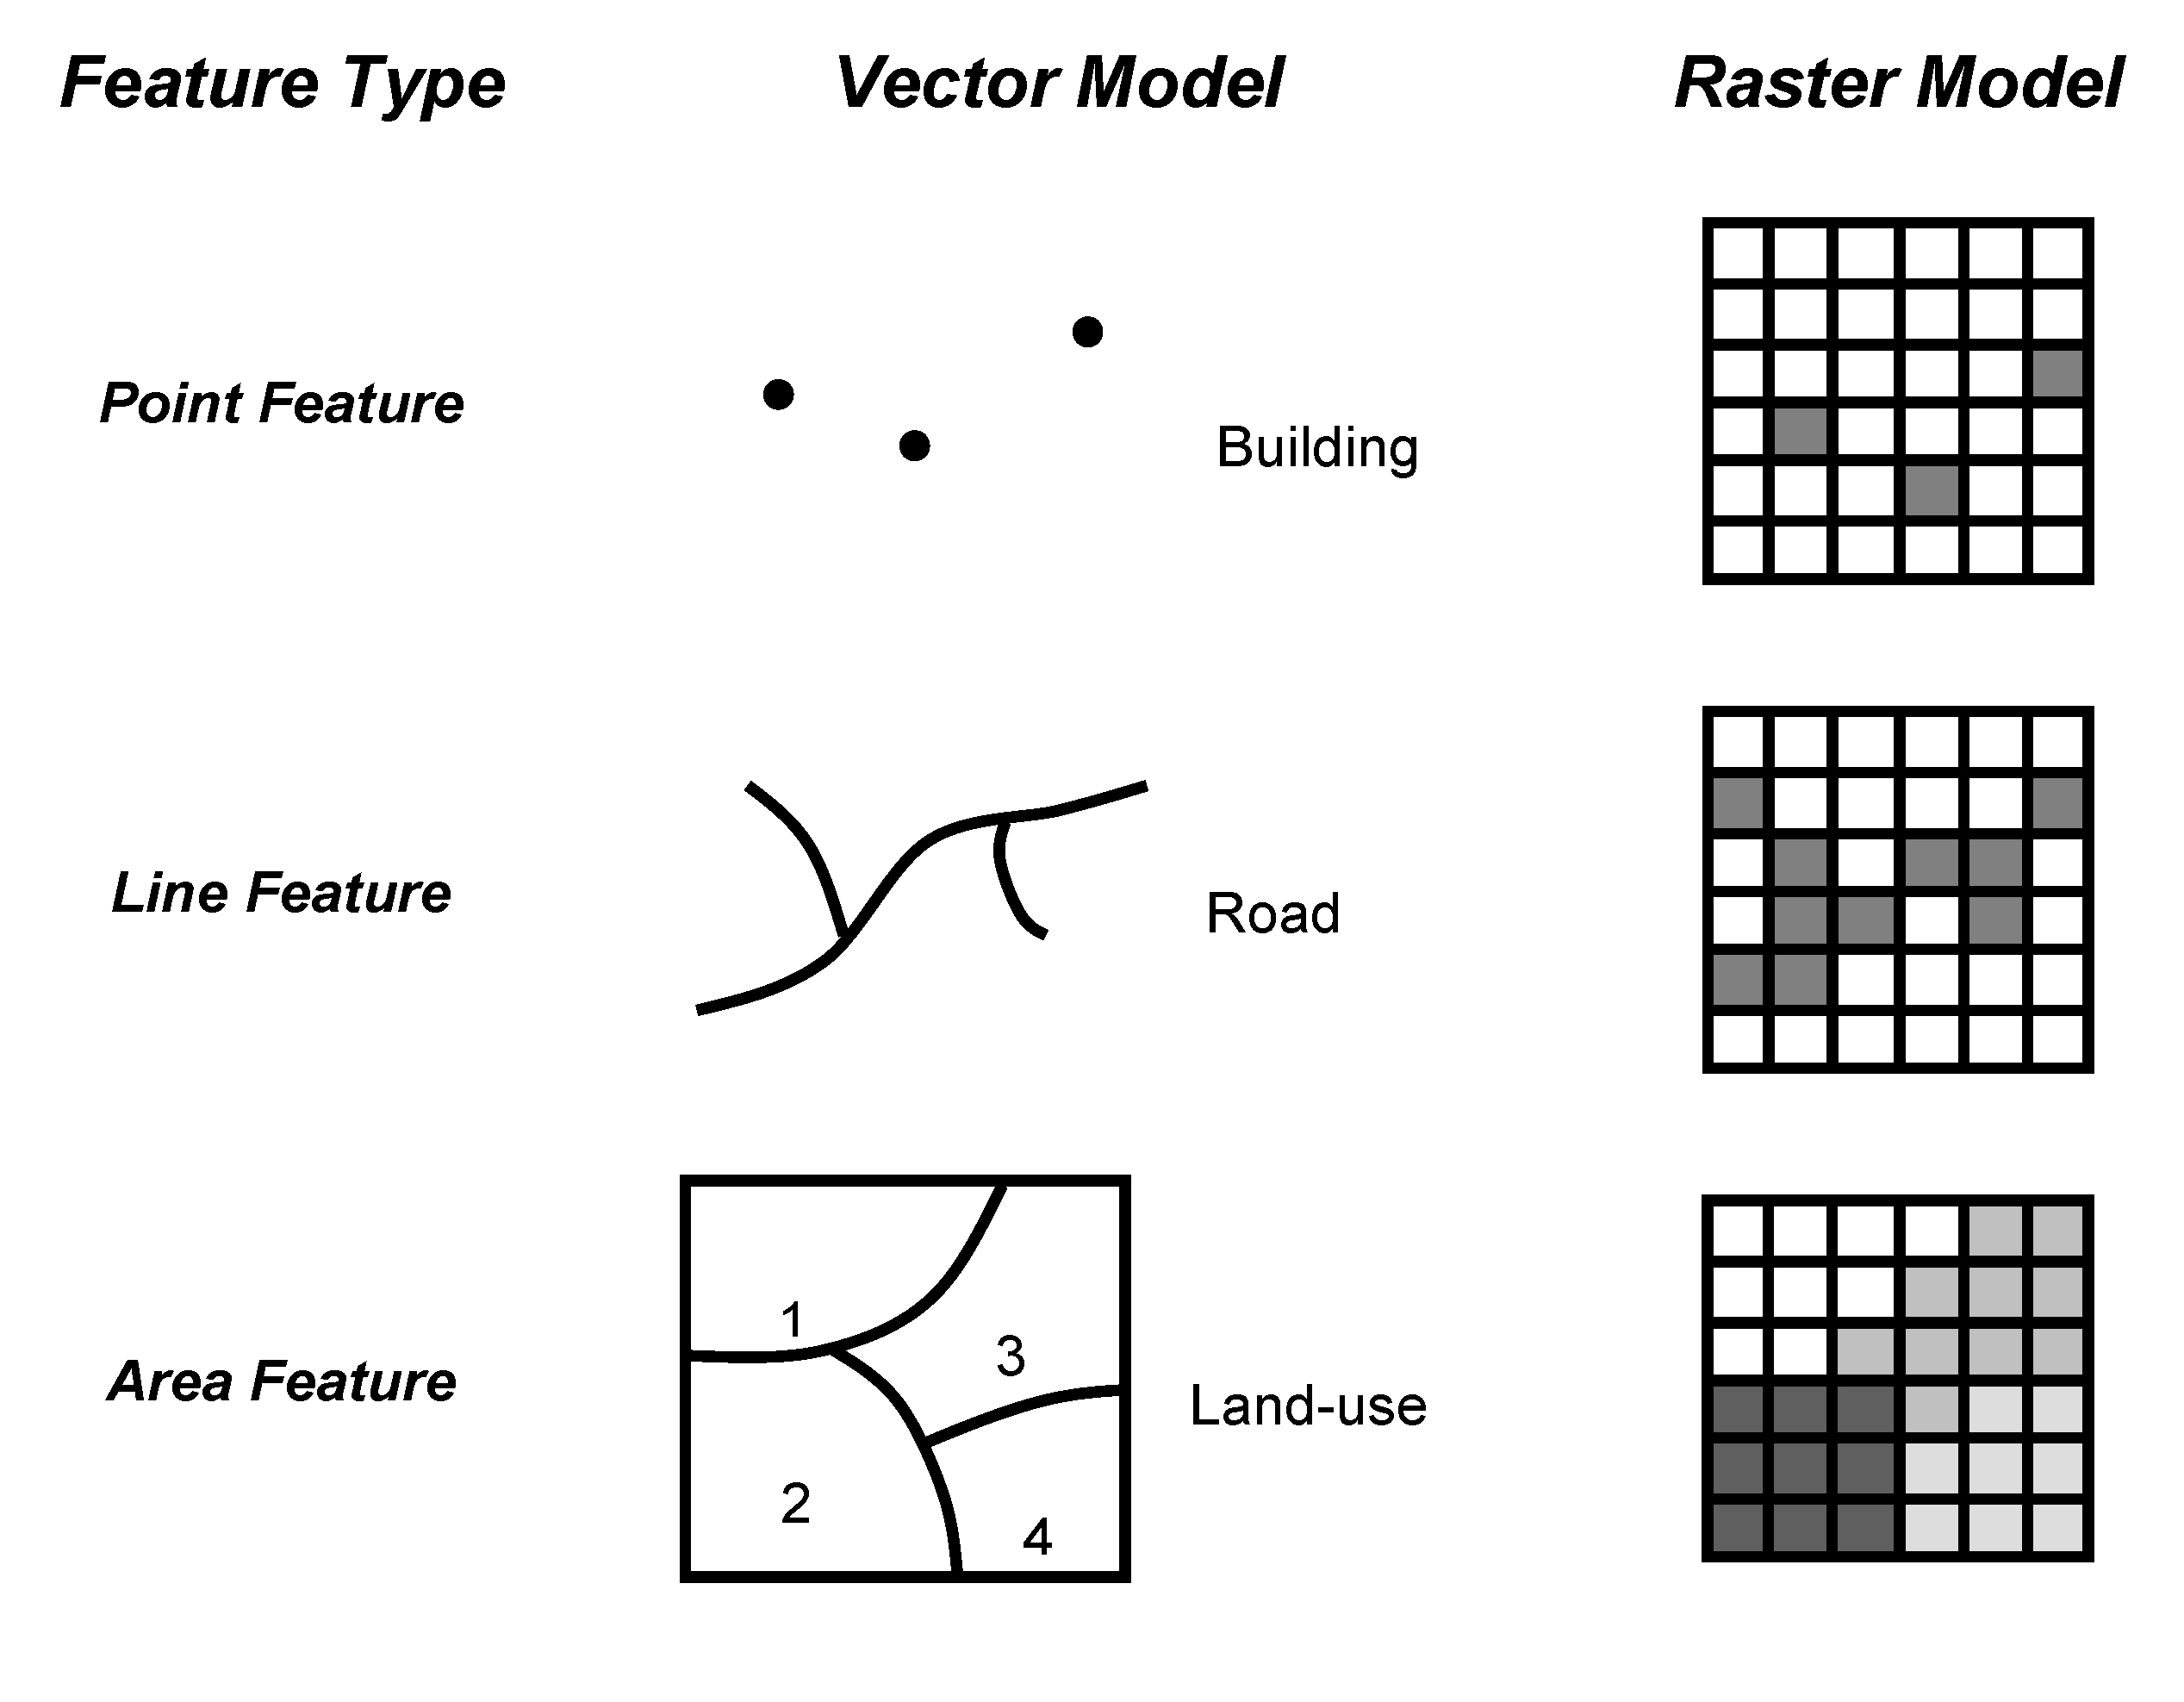
Types of Spatial Data
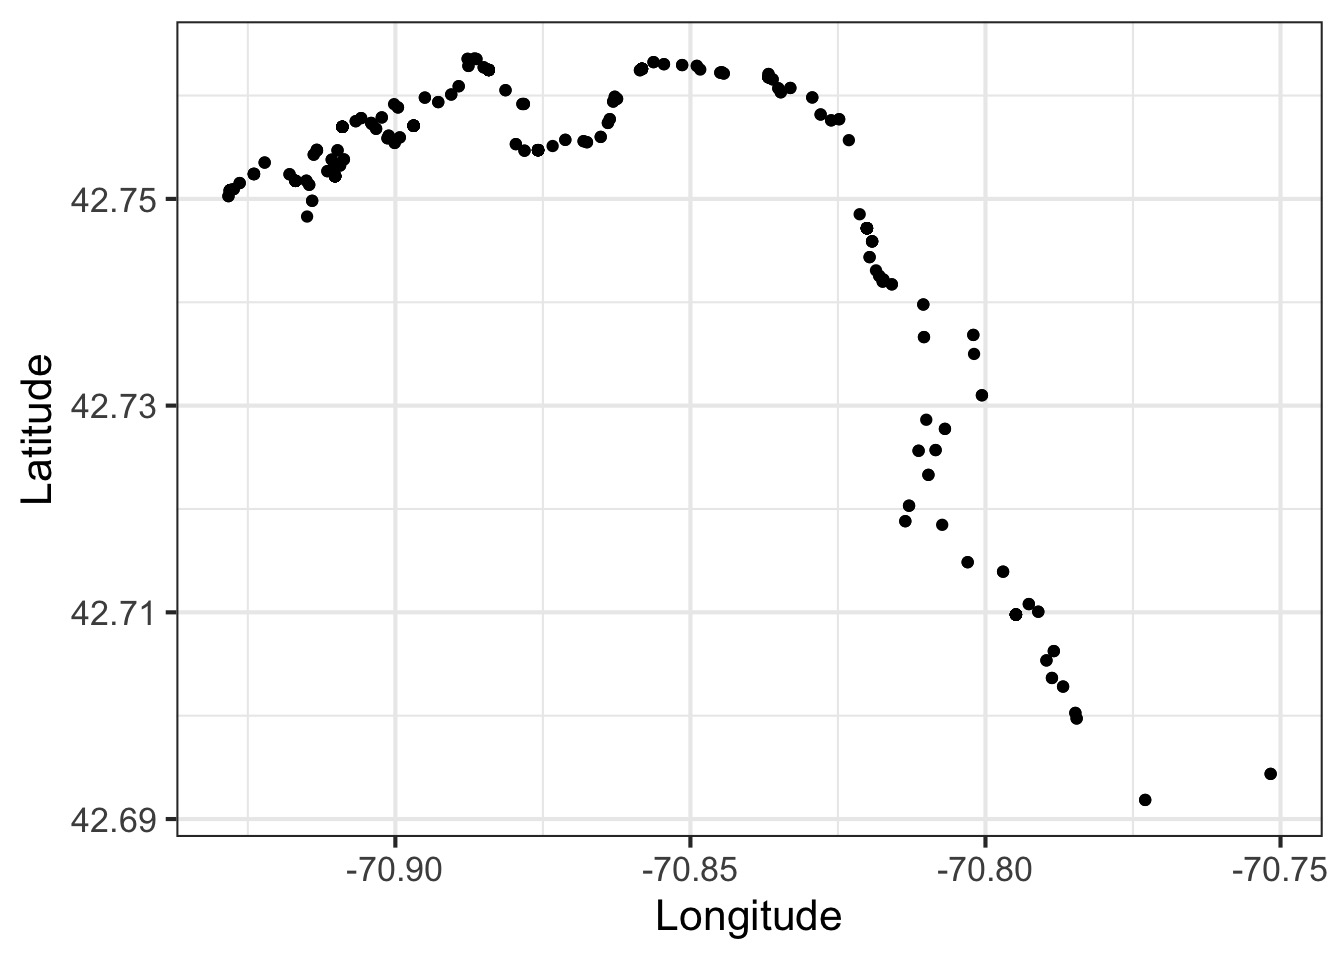
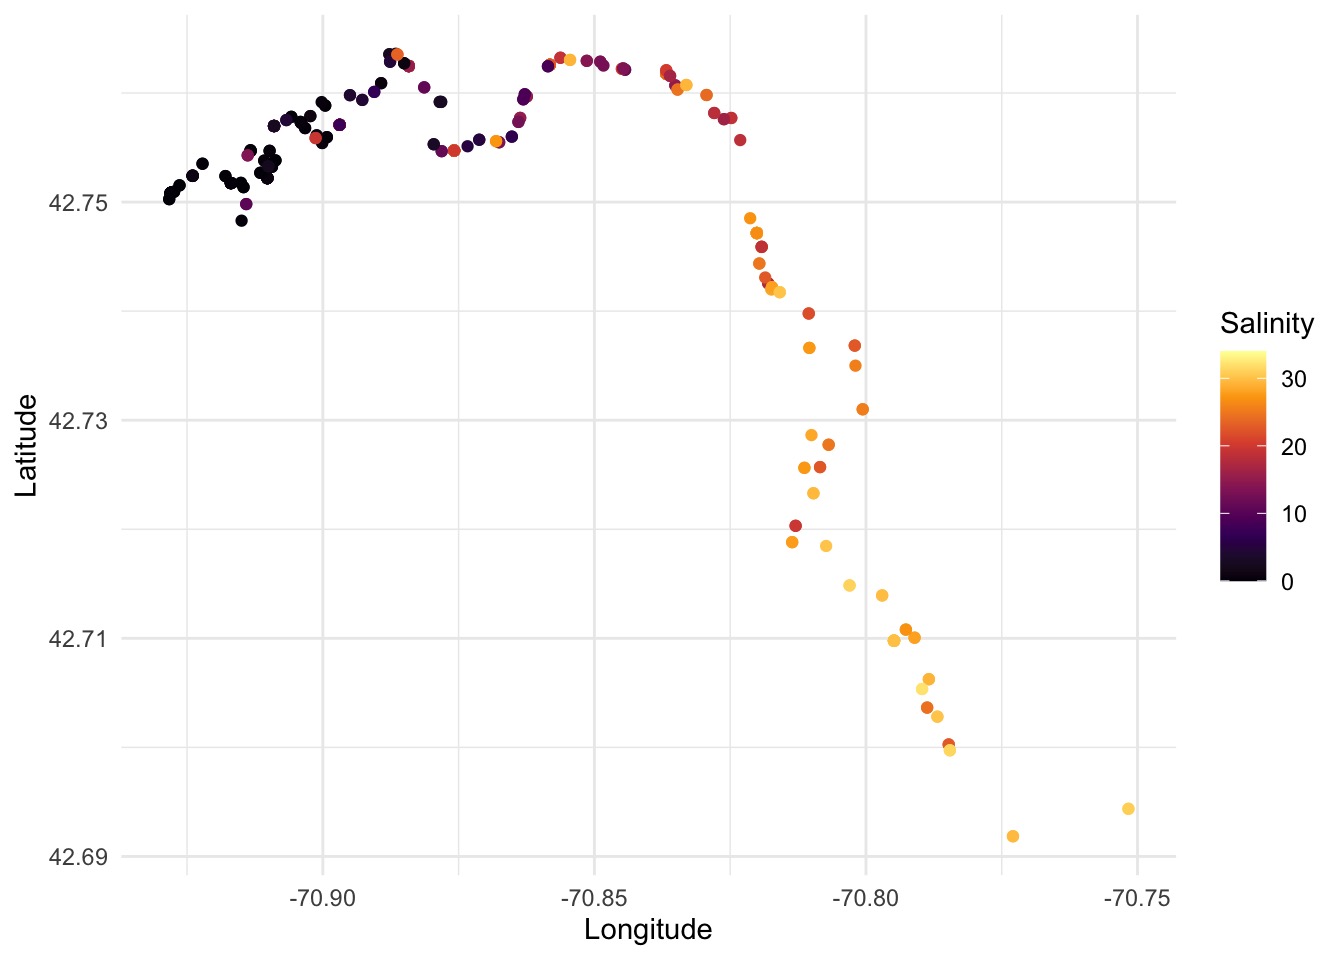
Points are Coordinates
Projections and Coordinate Reference Systems
Extent
Additional Information in Points!
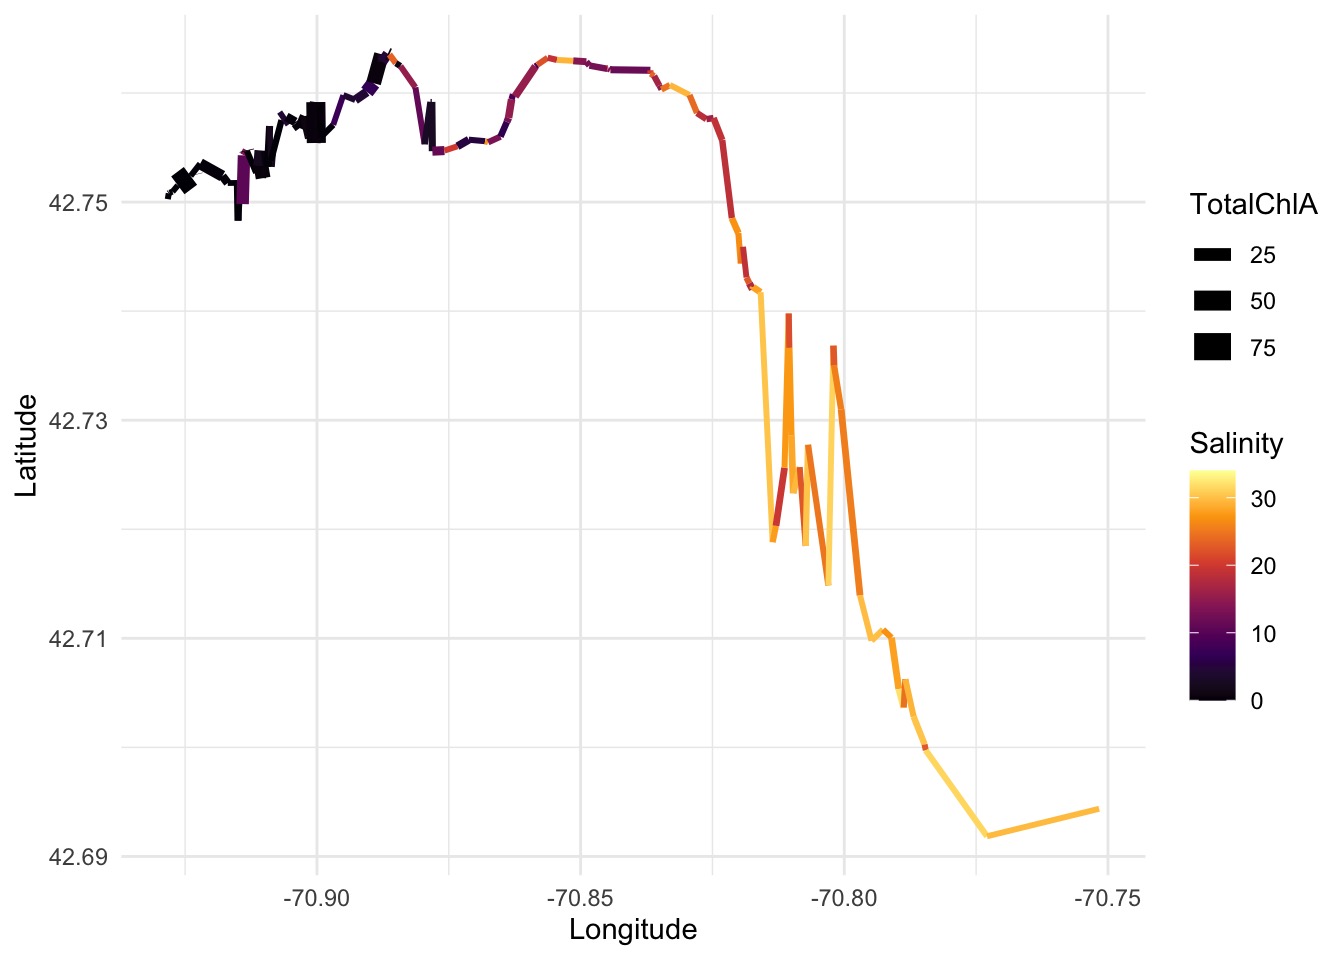
Lines Can Also Contain Information
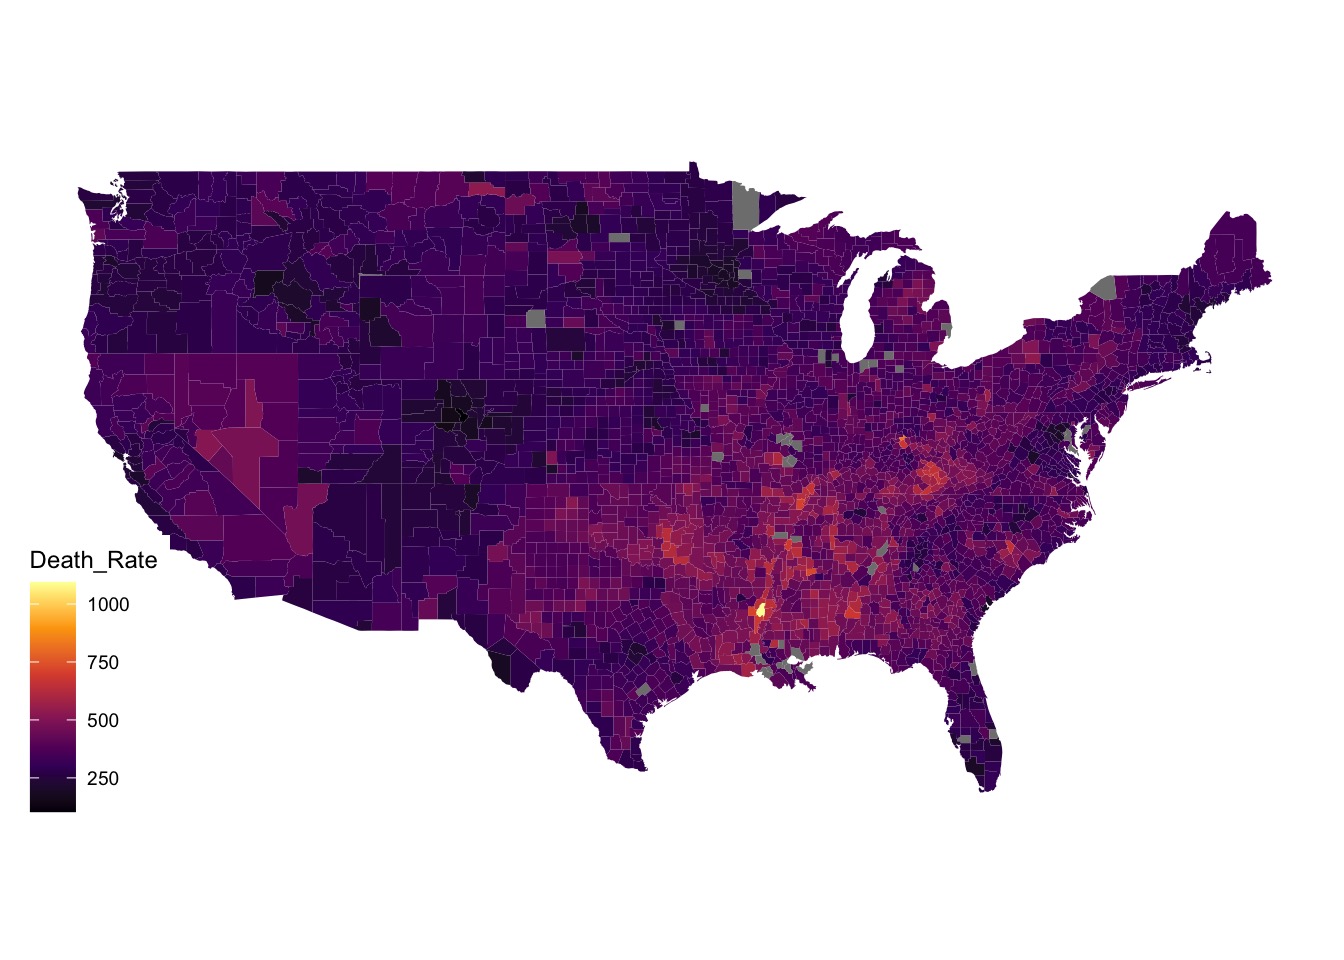
As can Polygons

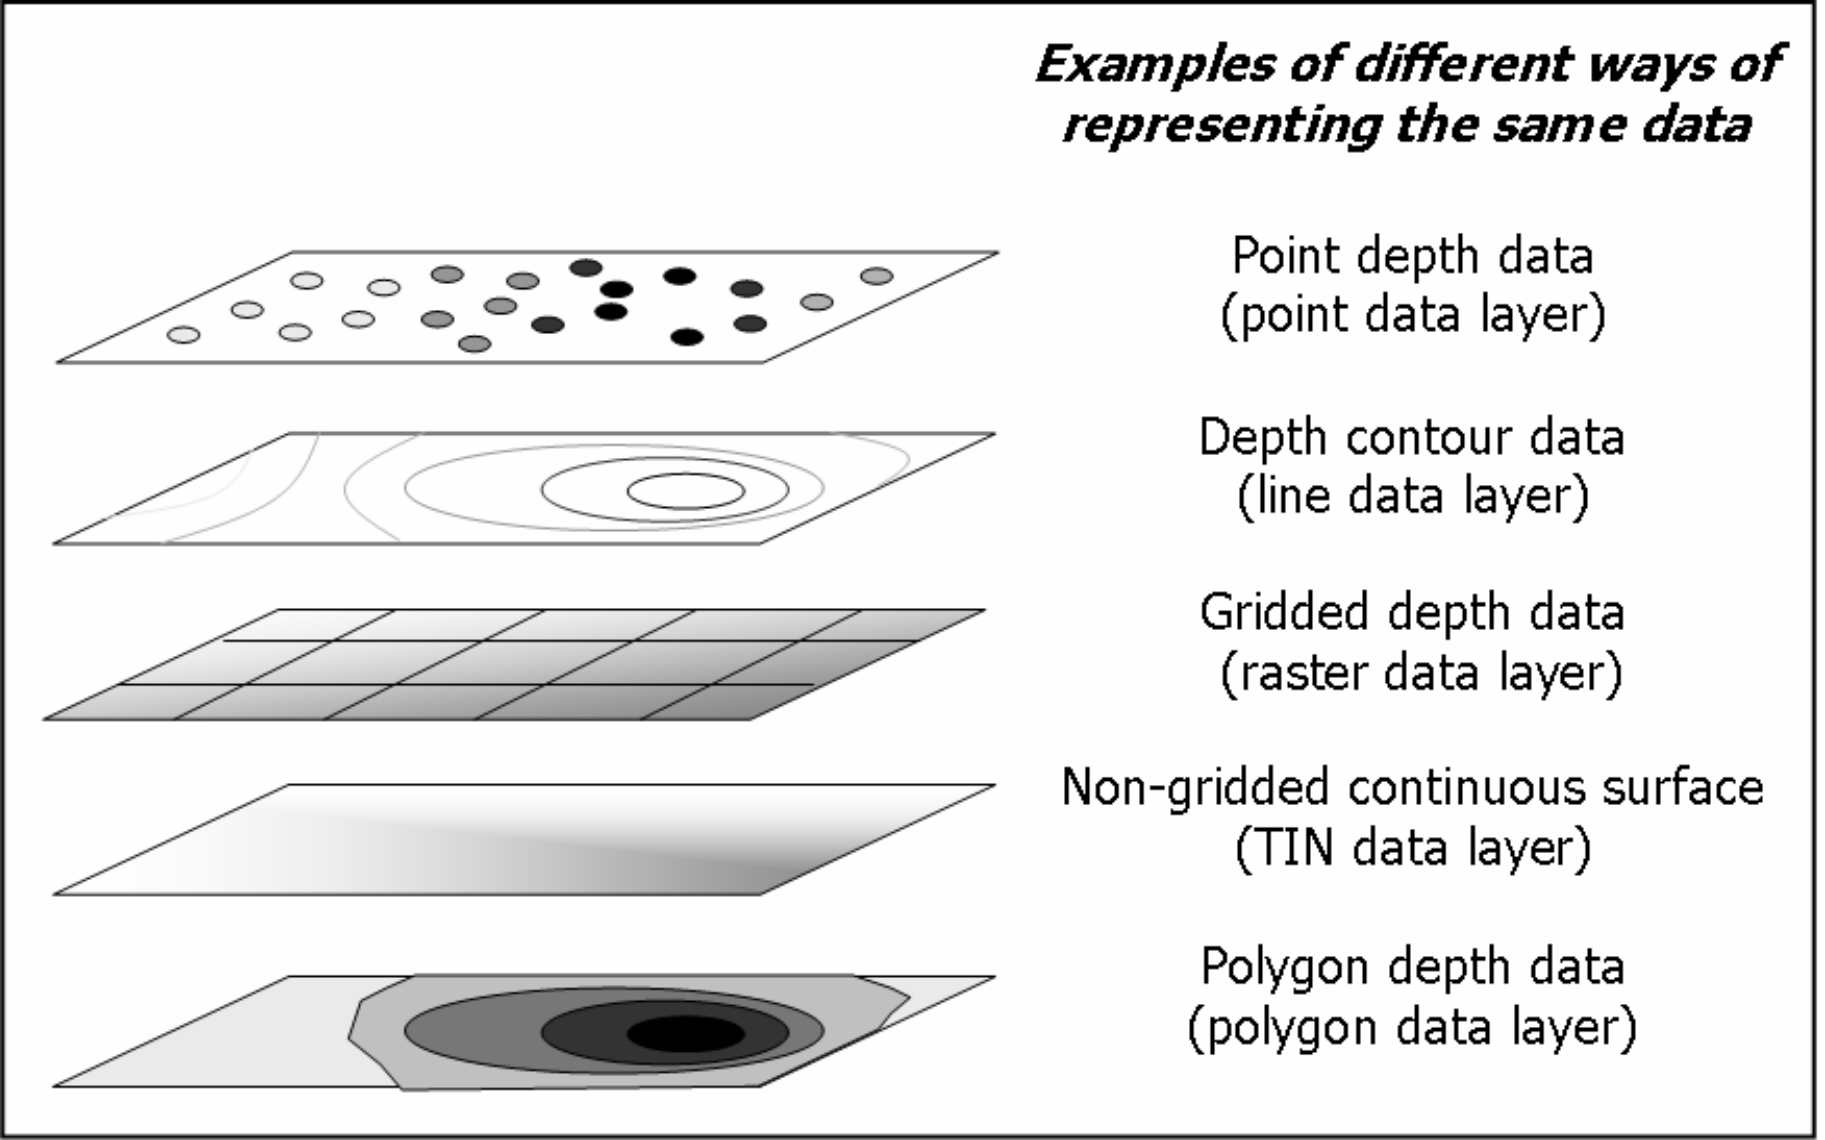
Many Ways of Representing the Same Data
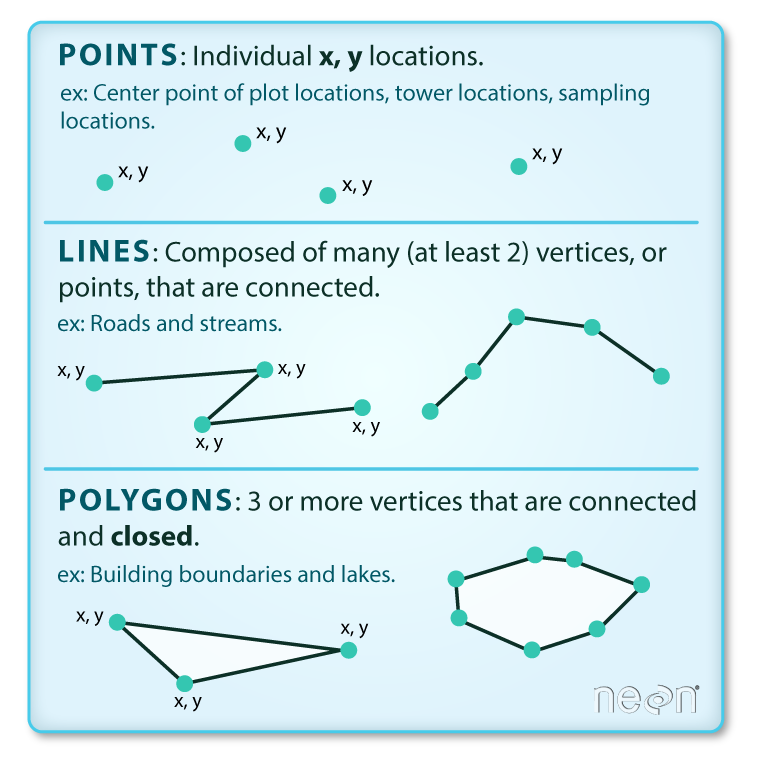
Vector Data
 {width = “75%”}
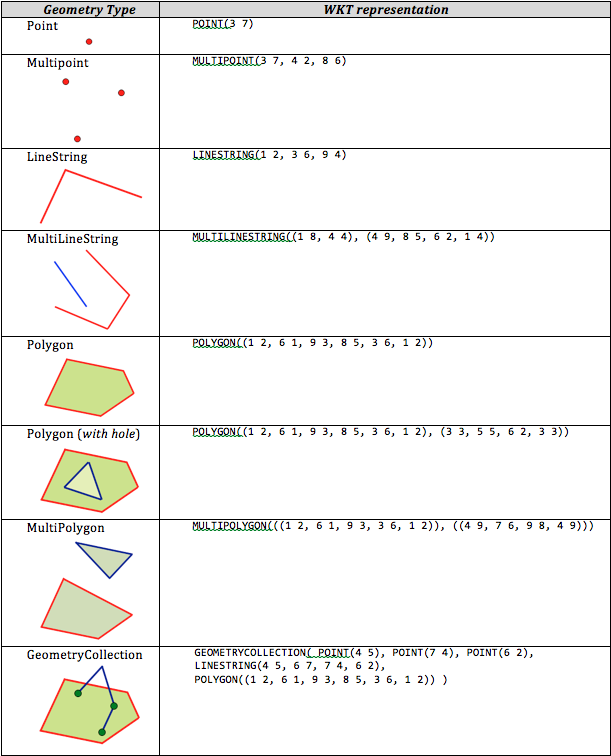
More Complex Vector Data
 {width = “85%”}
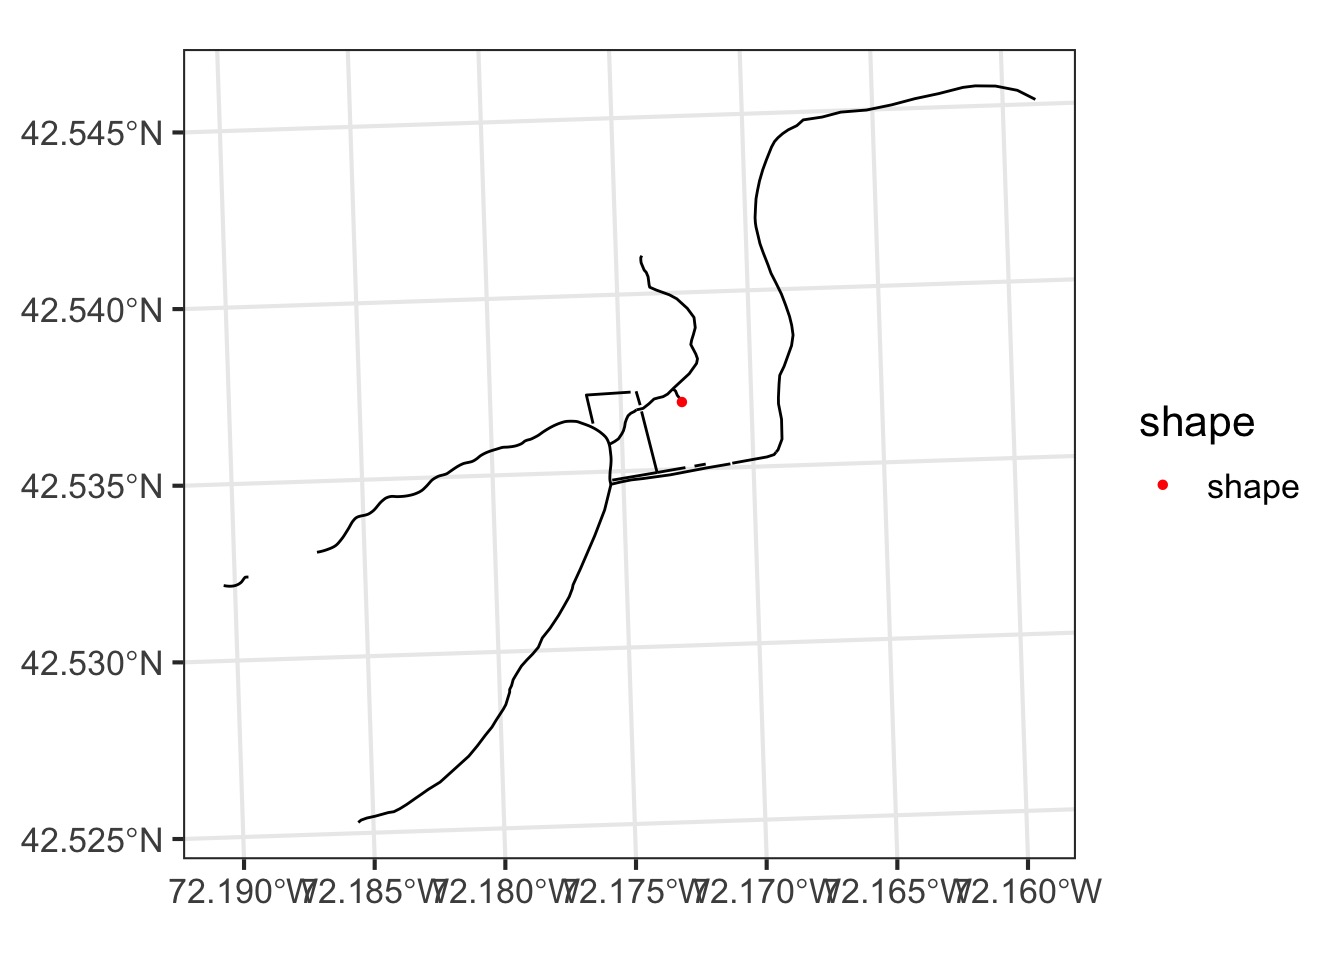
Points
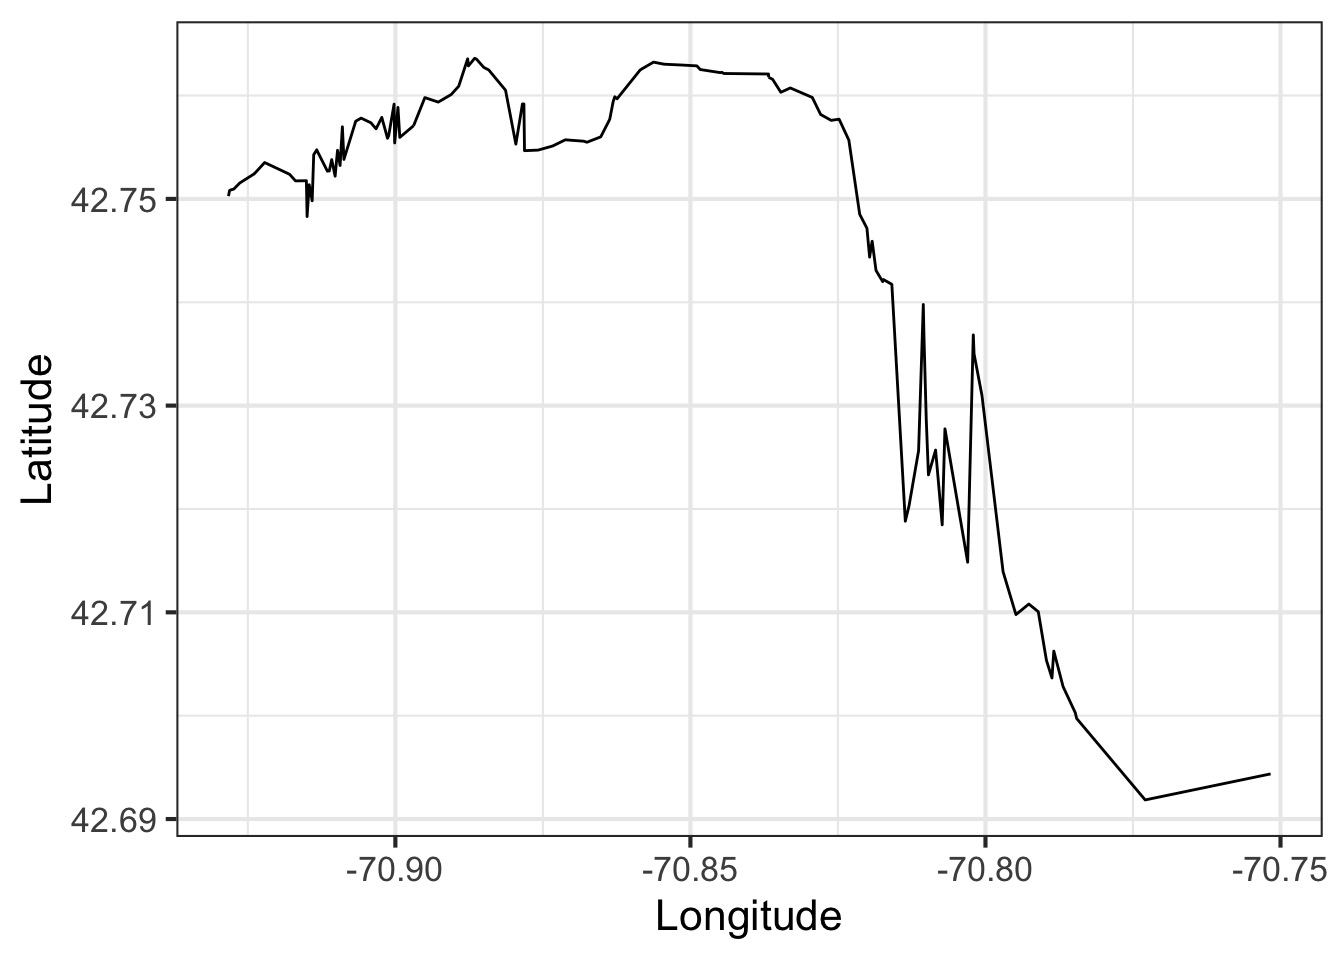
Lines (Paths)
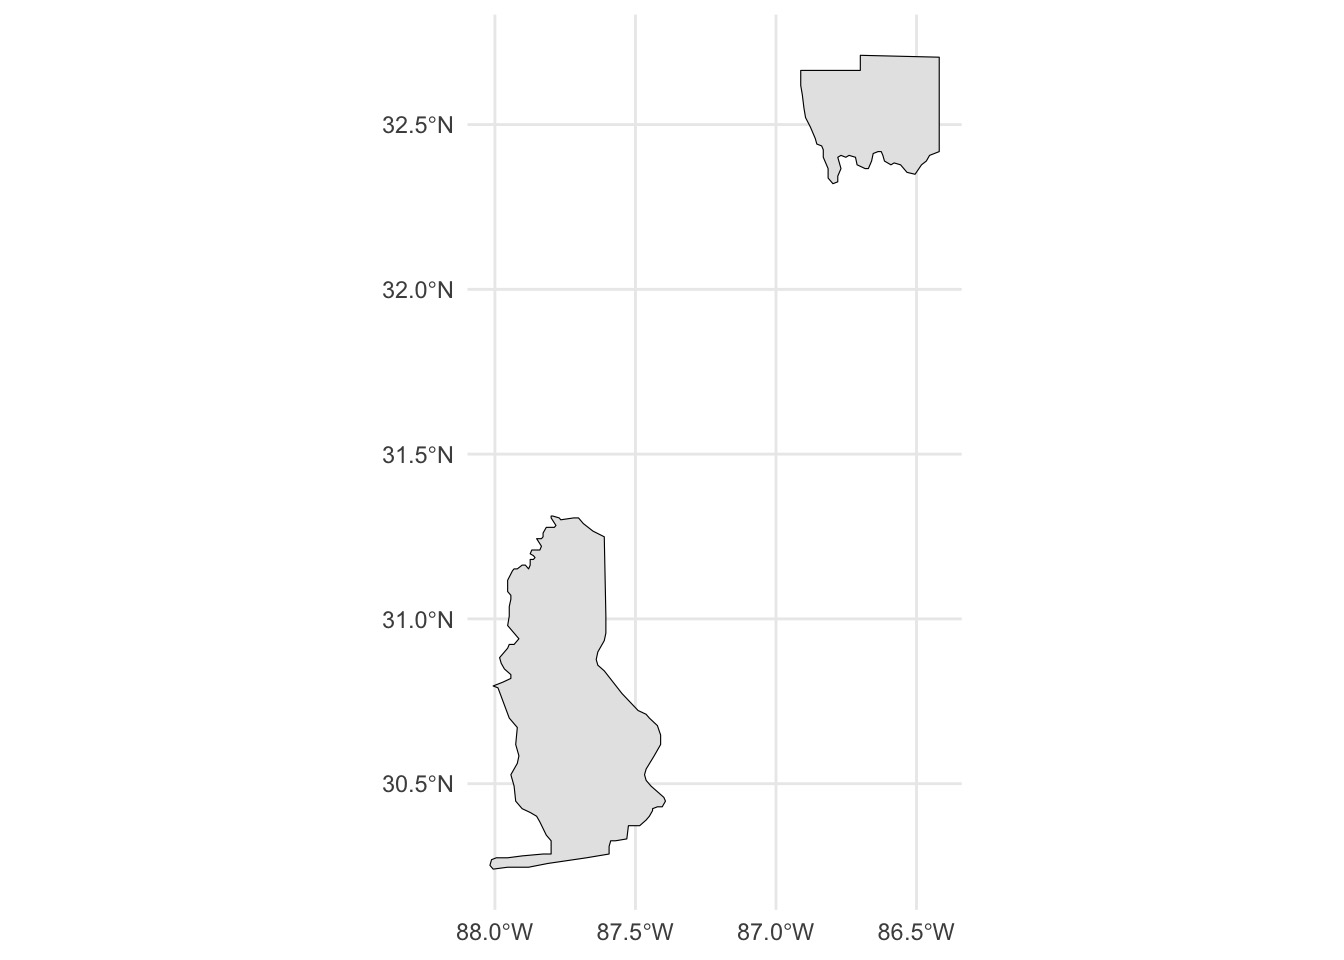
One Polygon

Two Polygons
Many Polygons
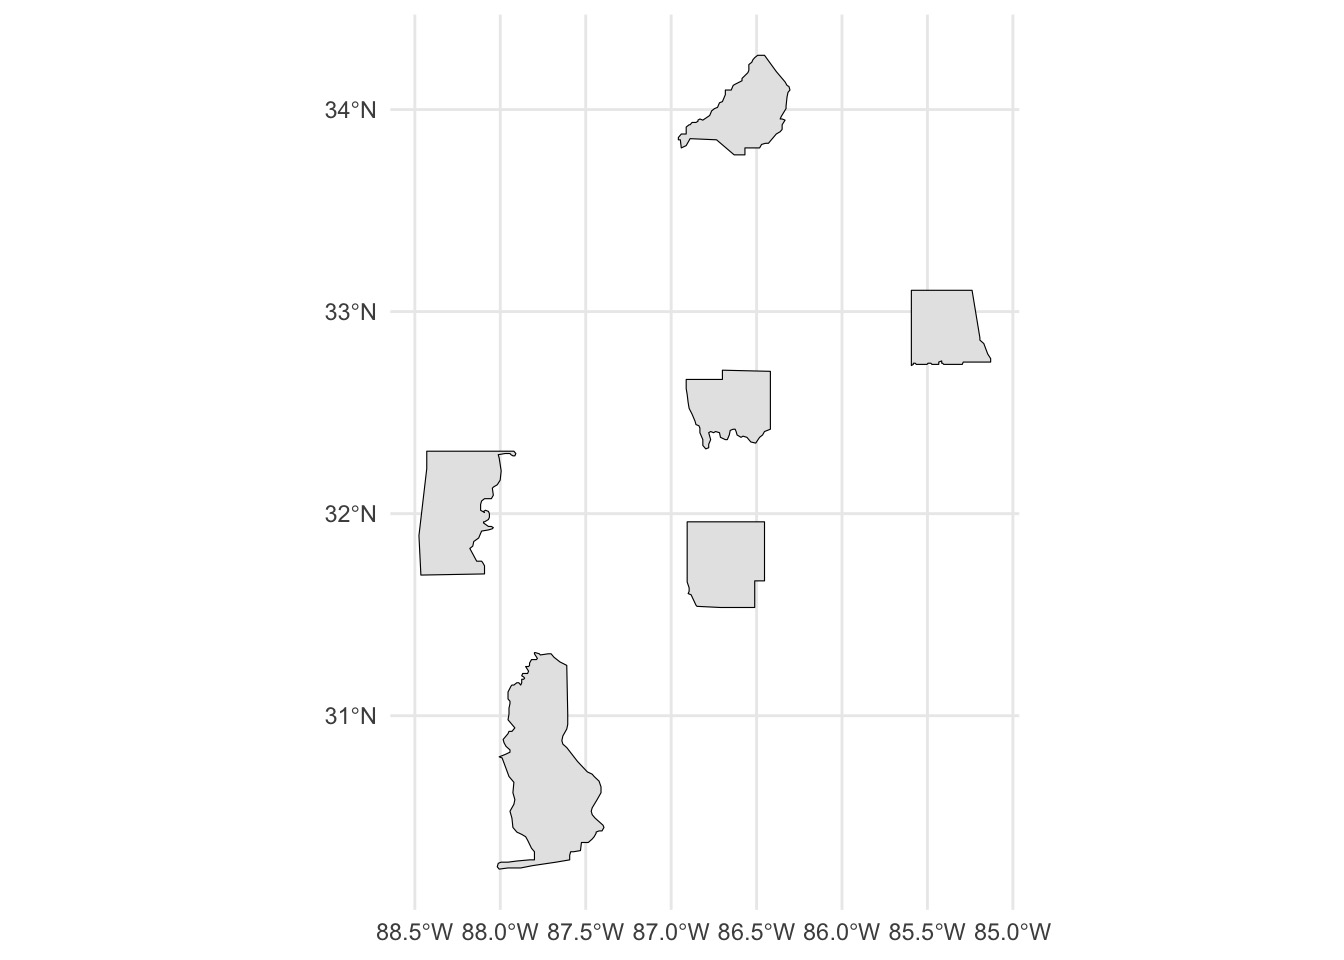
Many Polygons
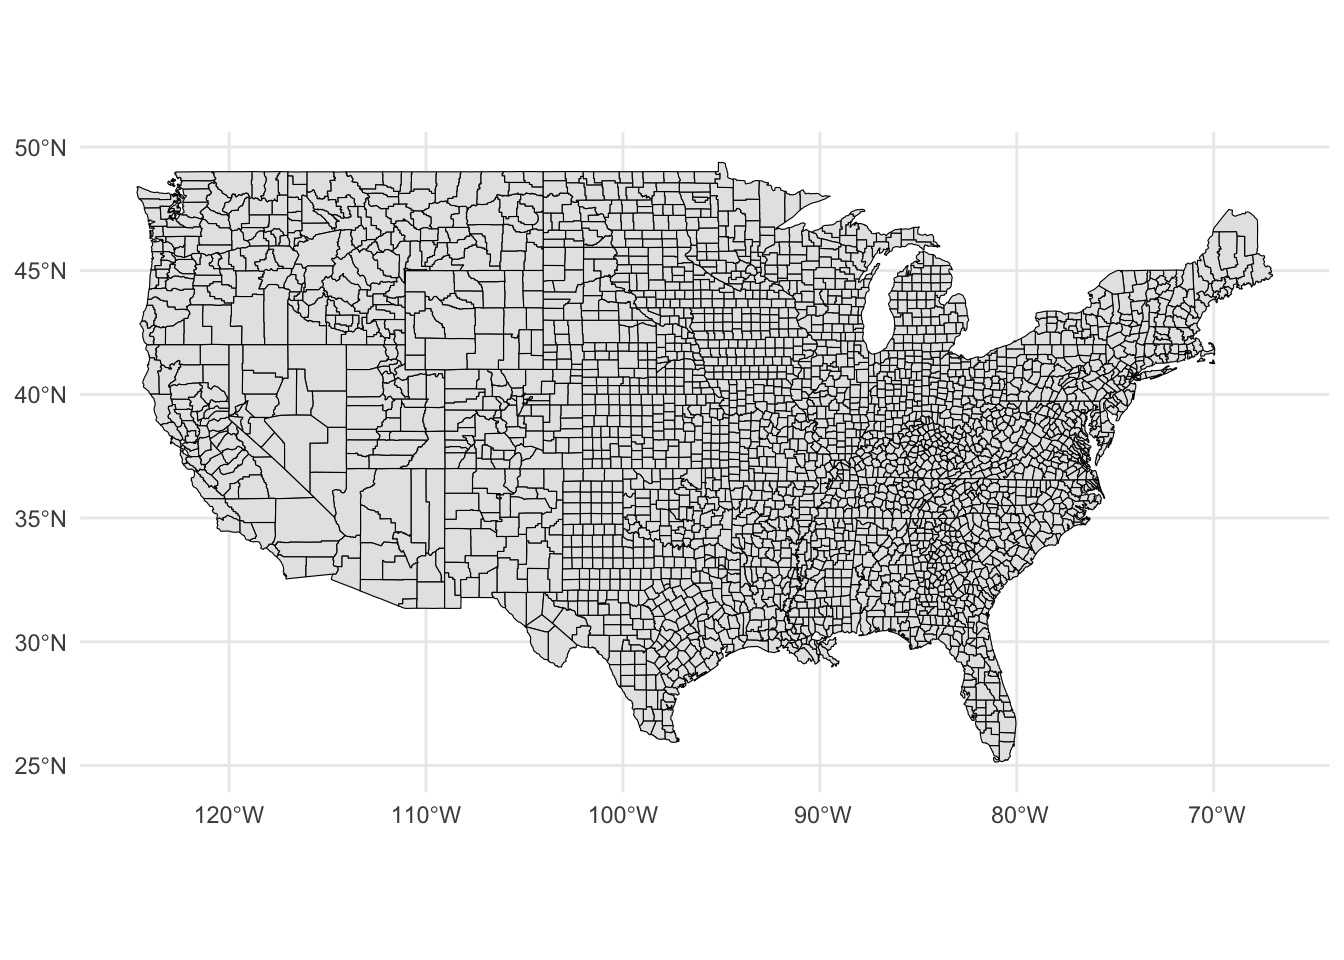
This is just vector data
Exercise: Identify these Vector Types

Exercise: Identify these Vector Types
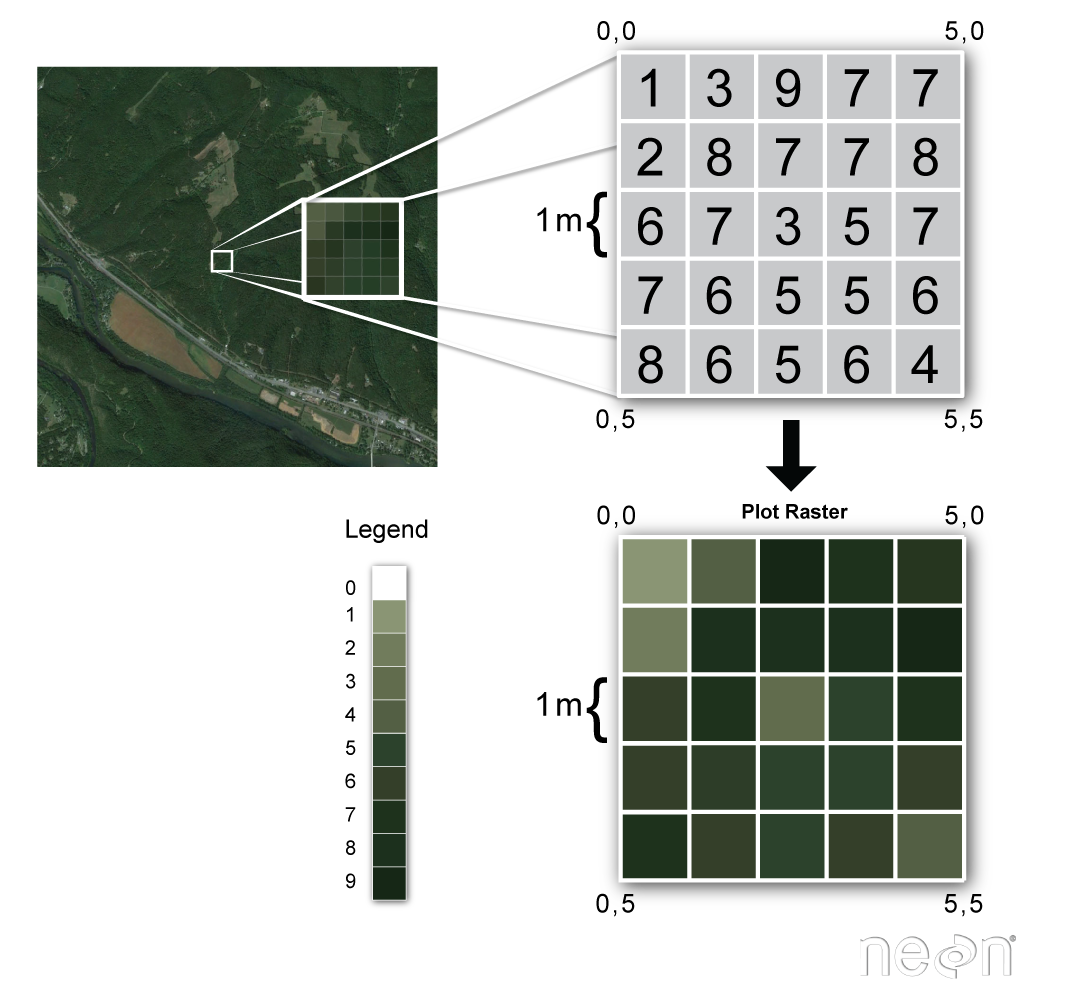
Rasters
Rasters versus Vector Files
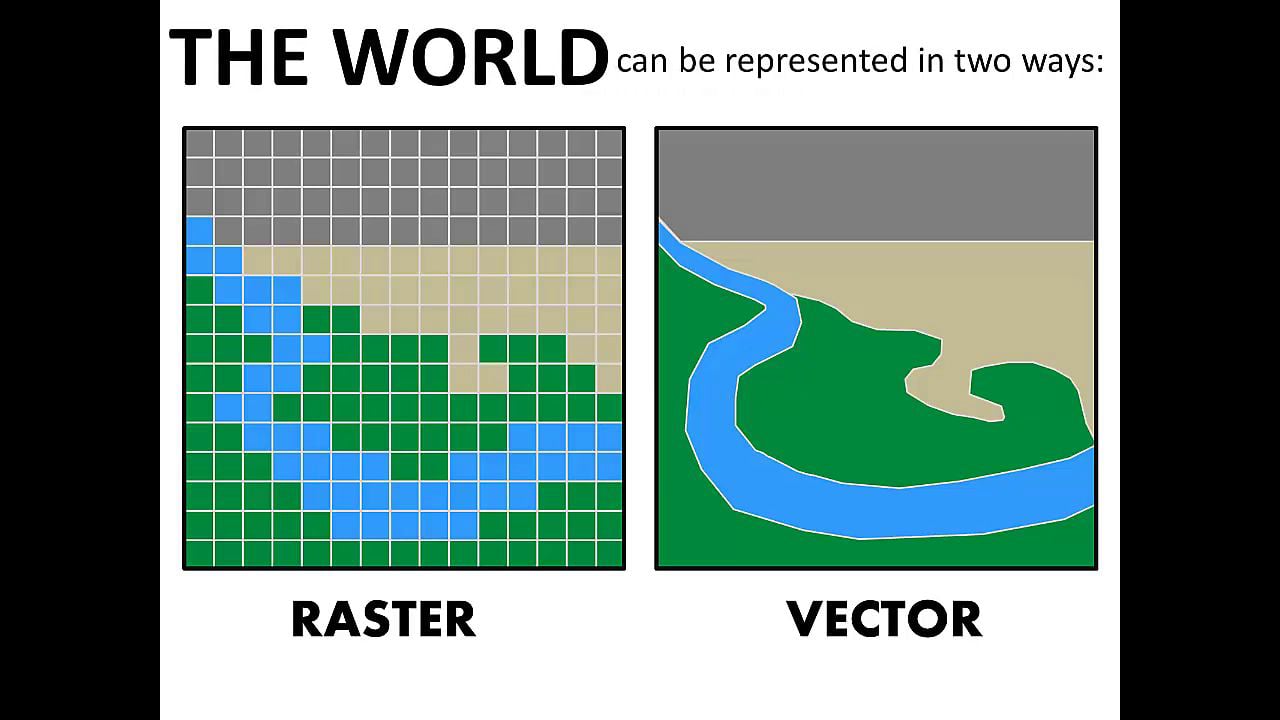
Rasters versus Vector Files
Raster Stacks/Bricks
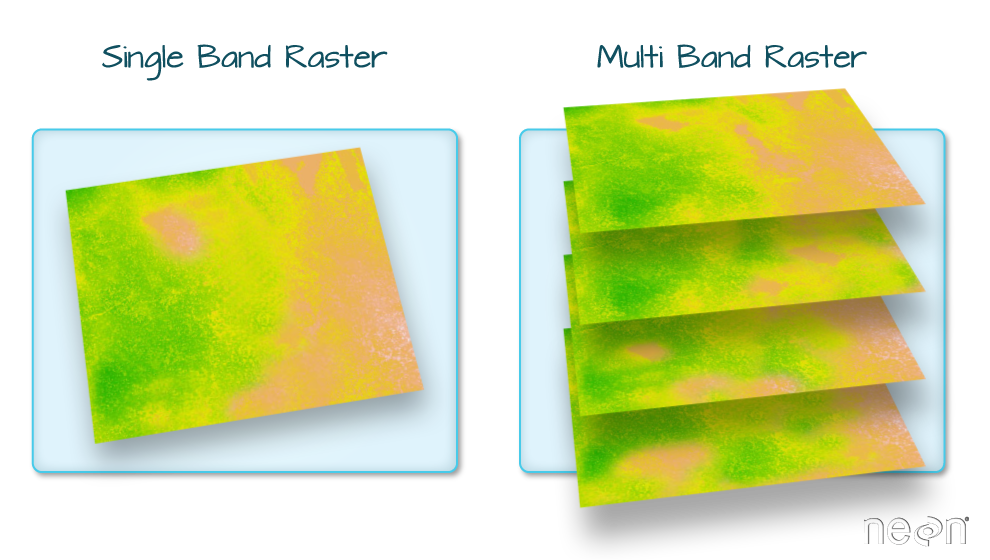
Multi-band Raster Data = RGB image!
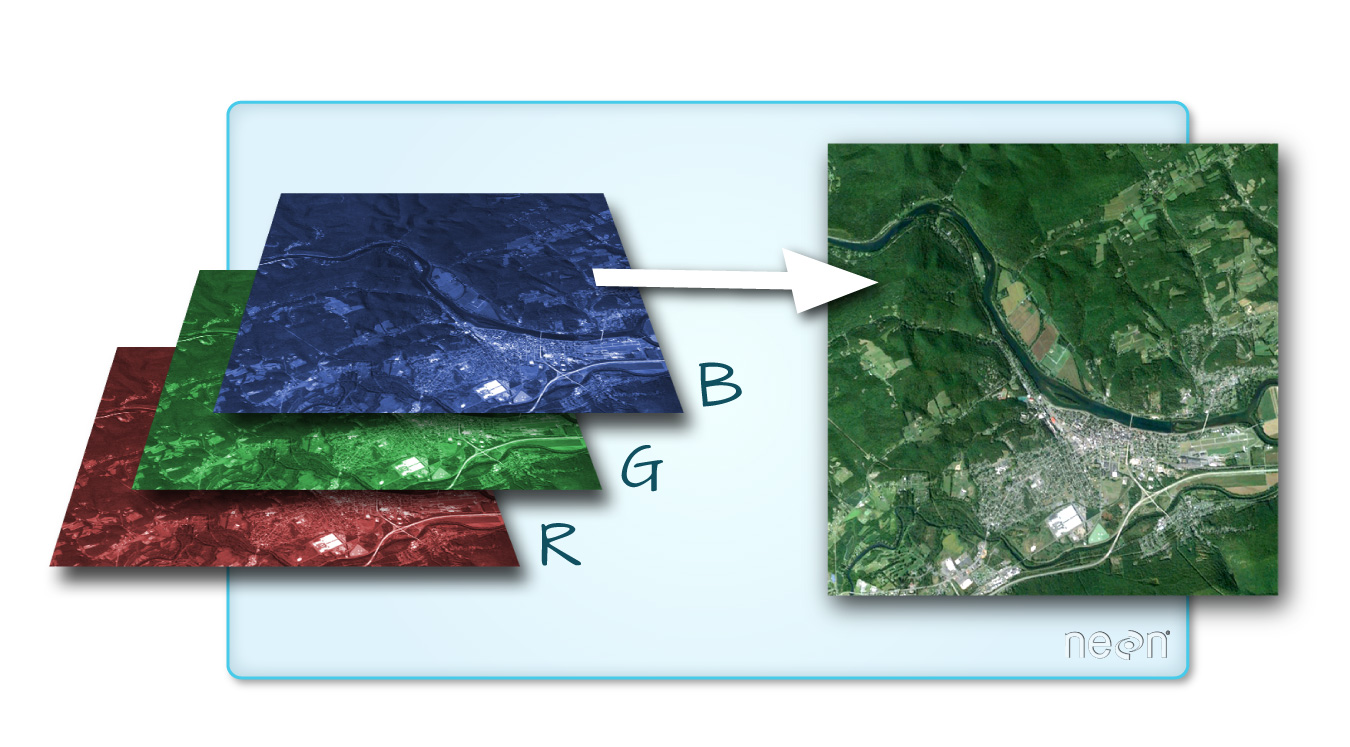
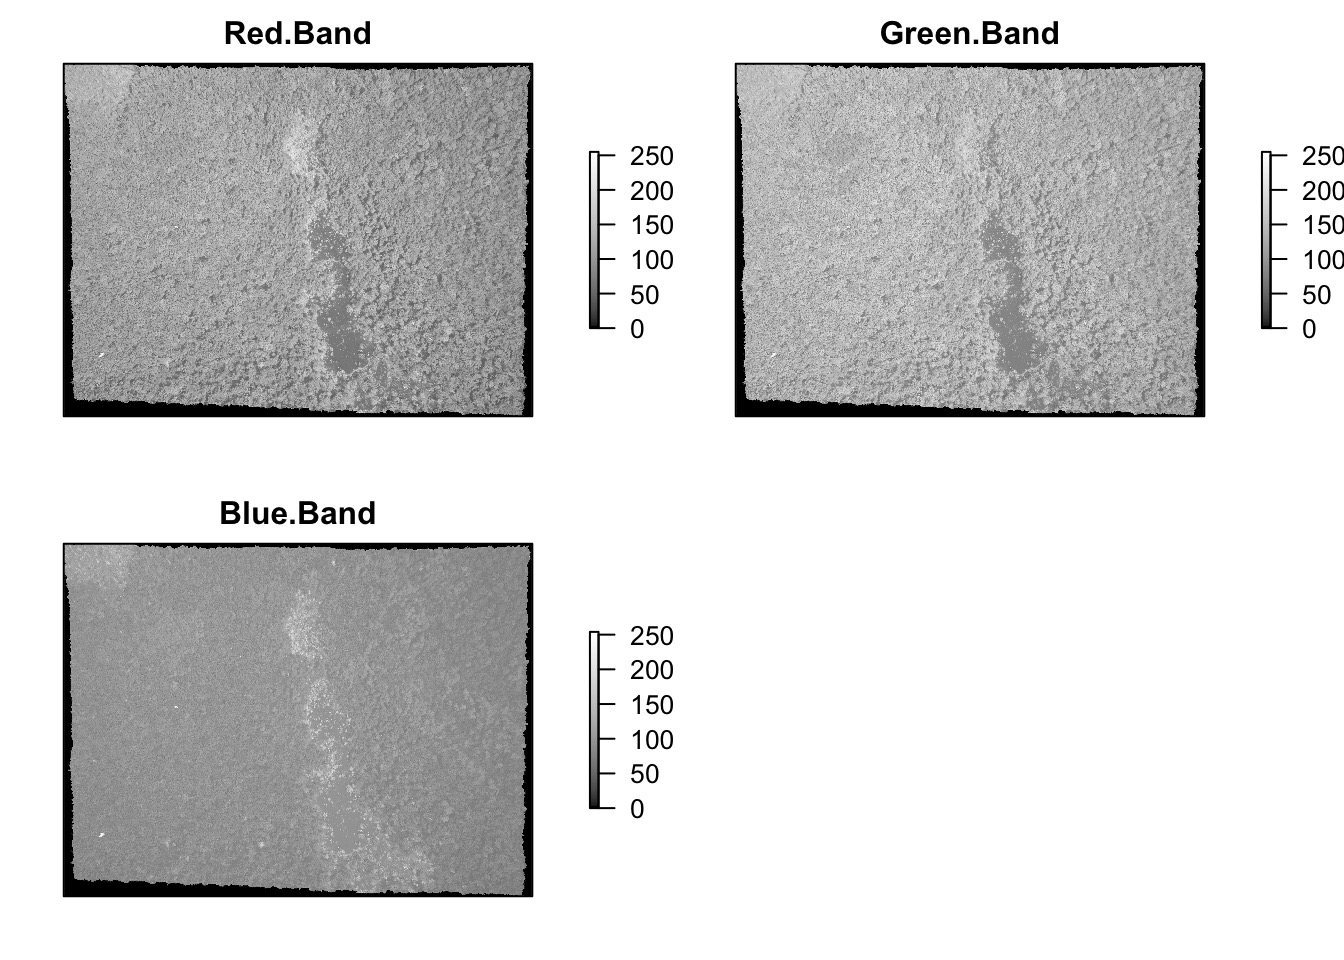
Individual Bands
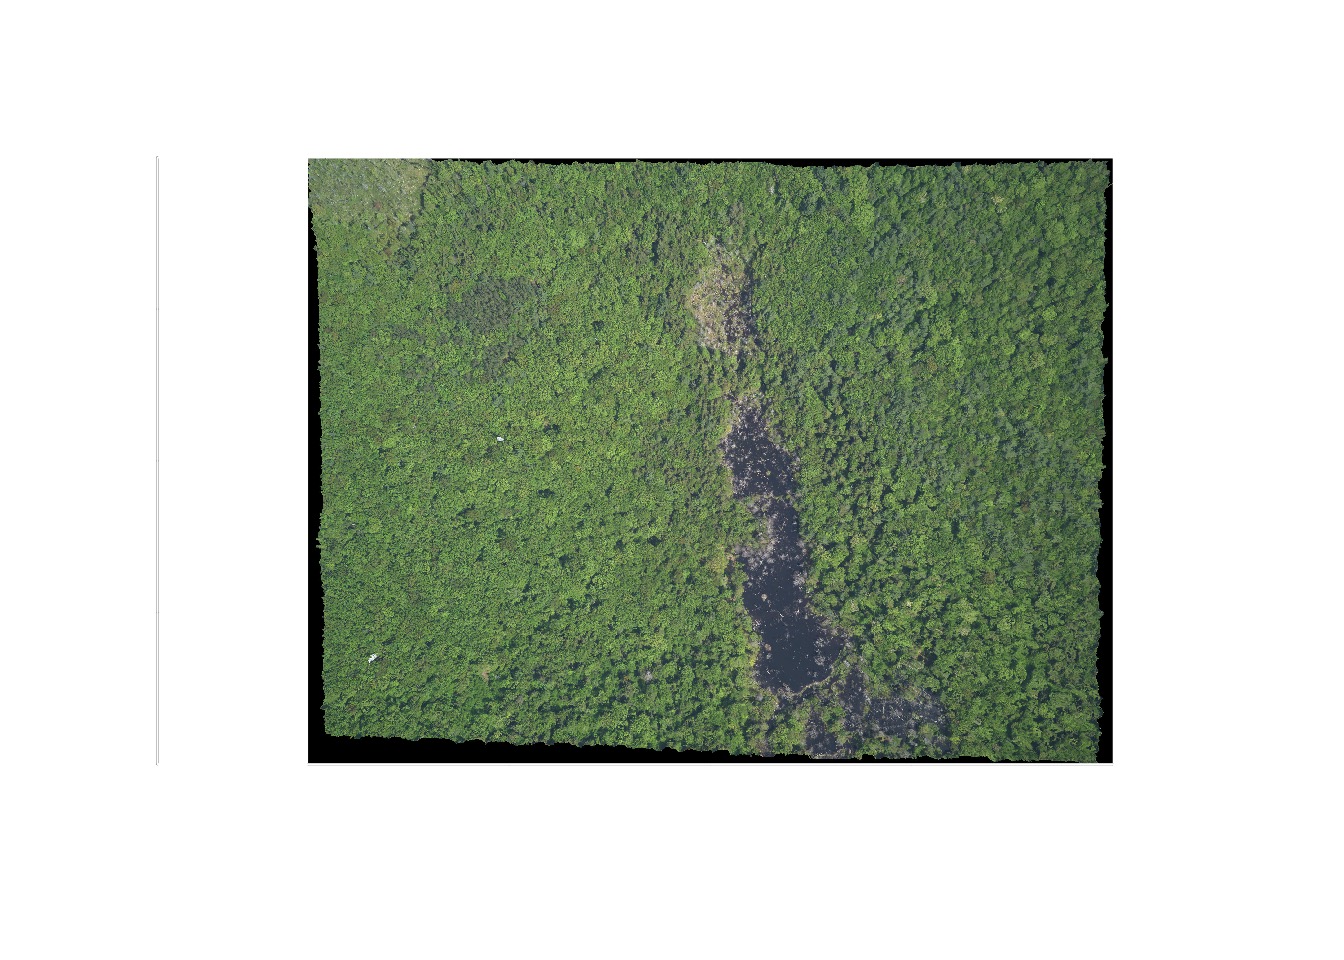
Composite Image
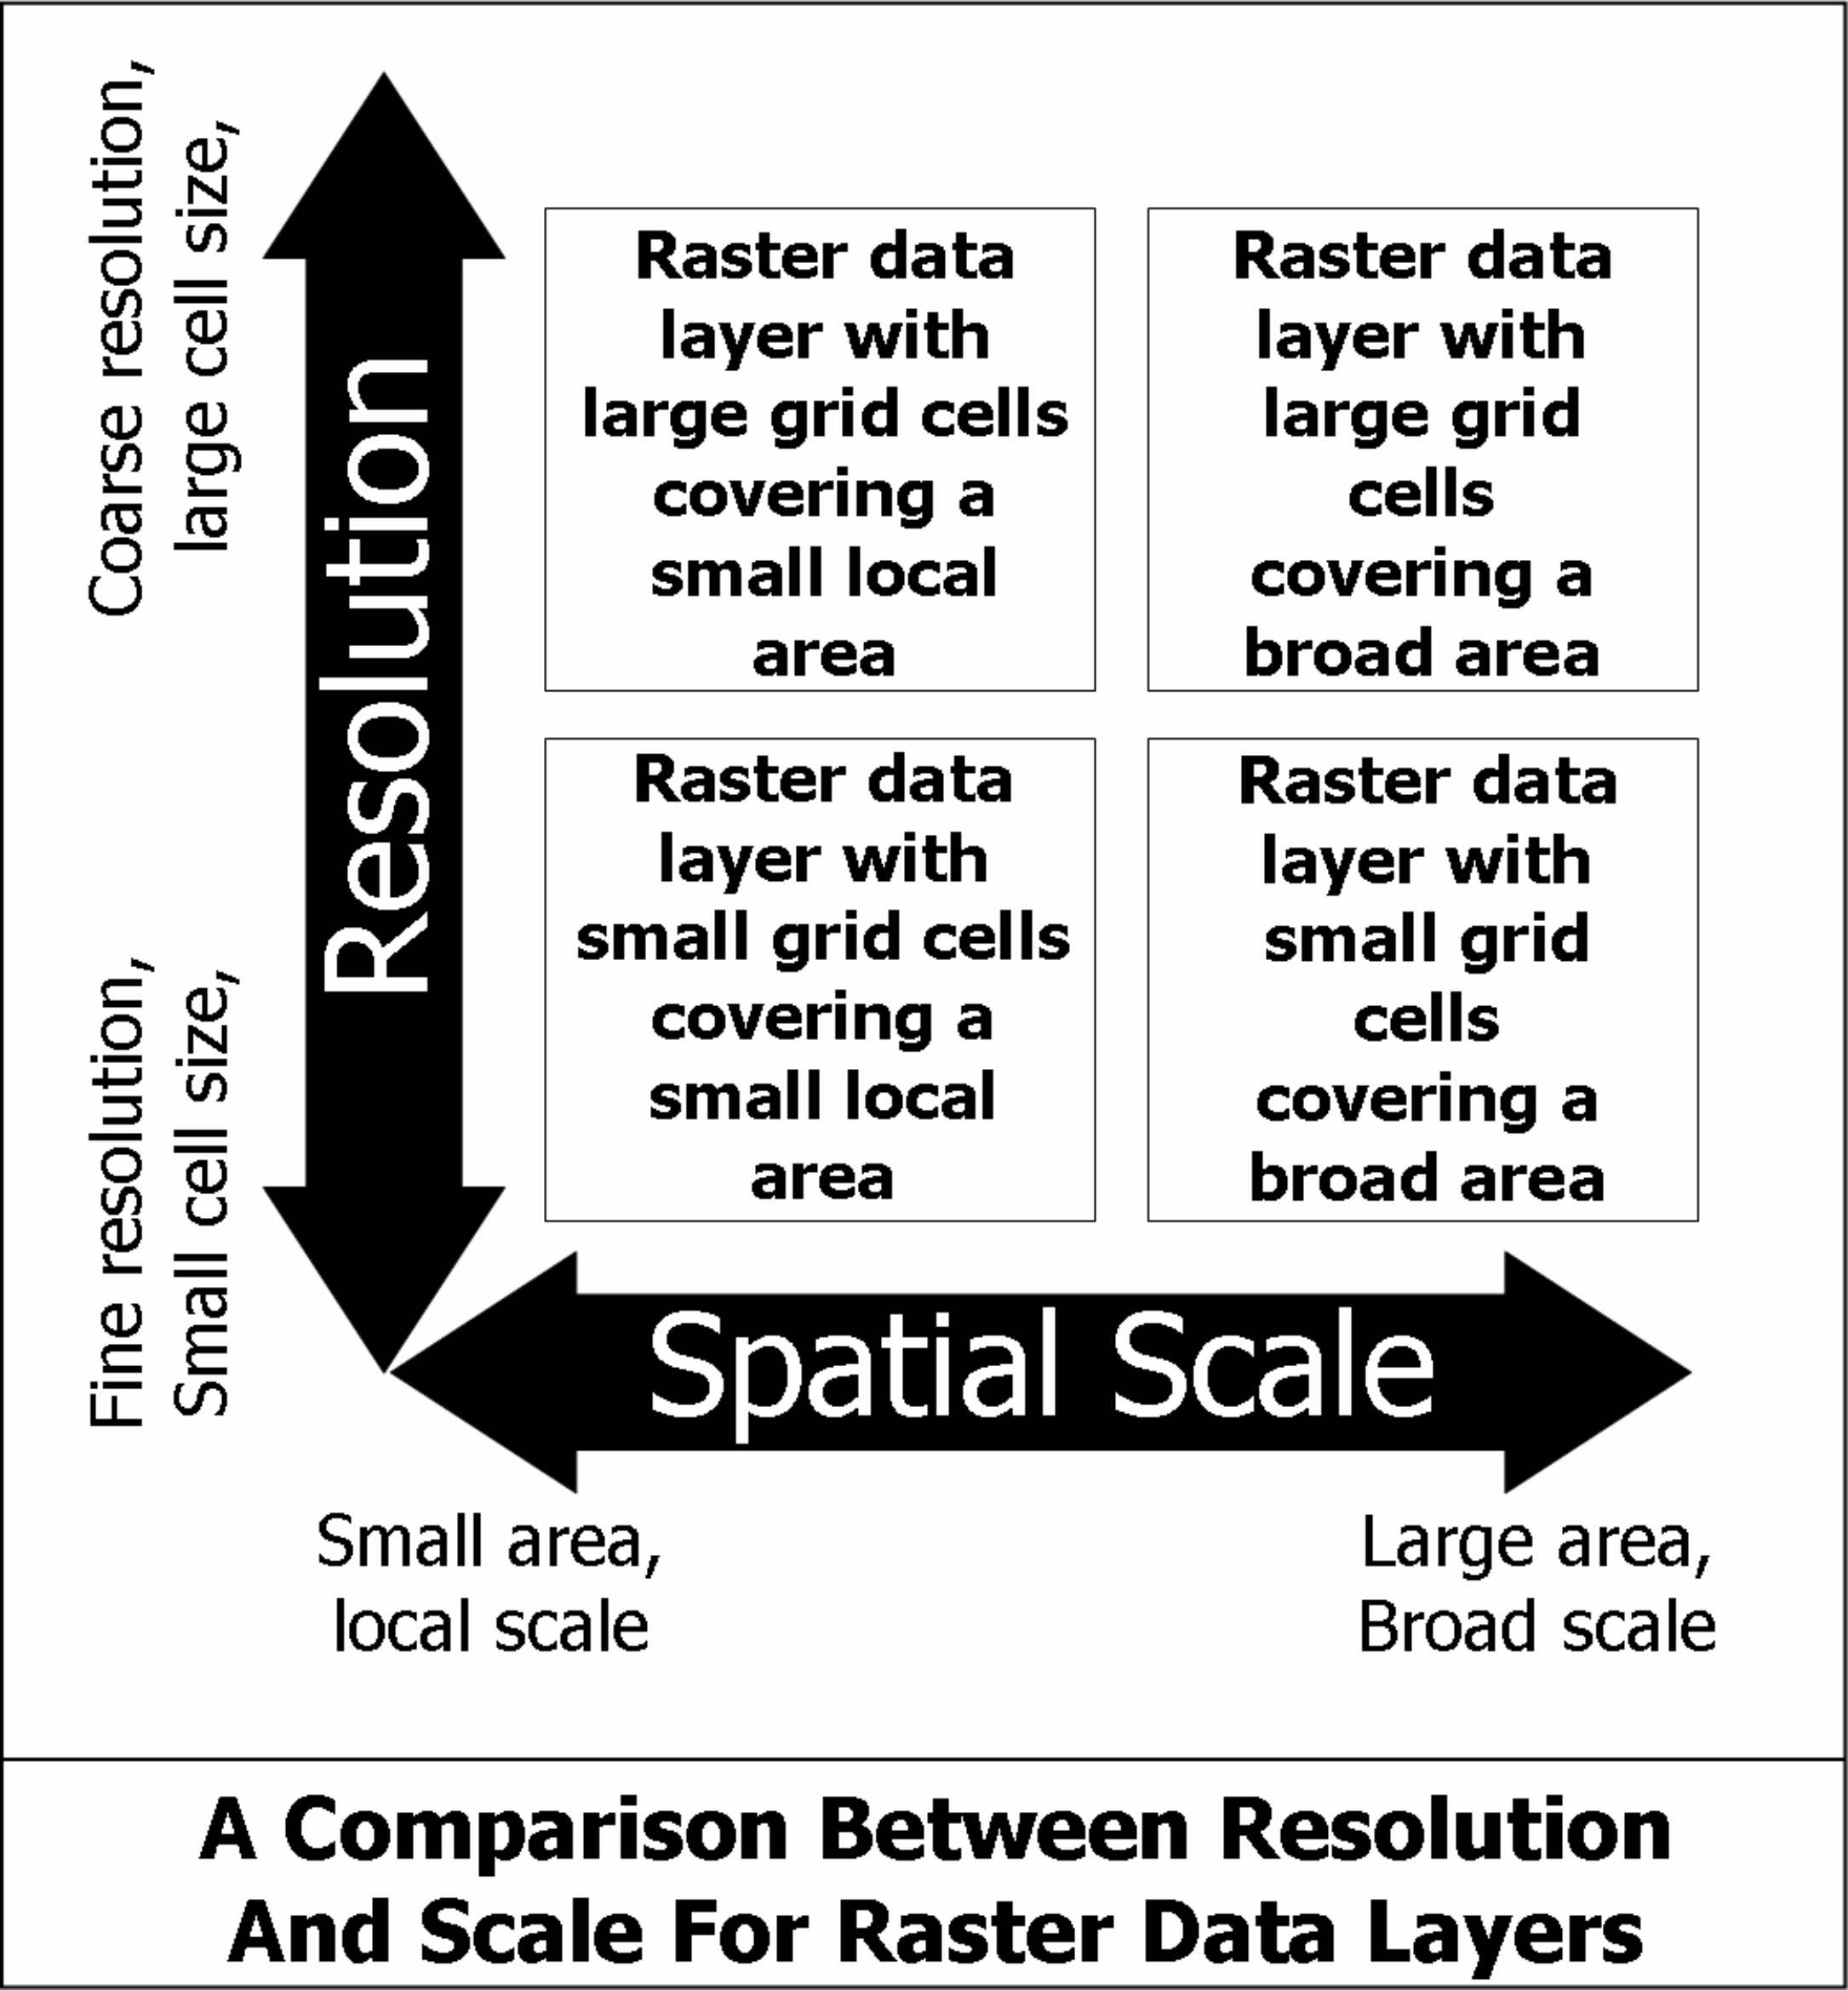
With rasters, we have to think of Resolution
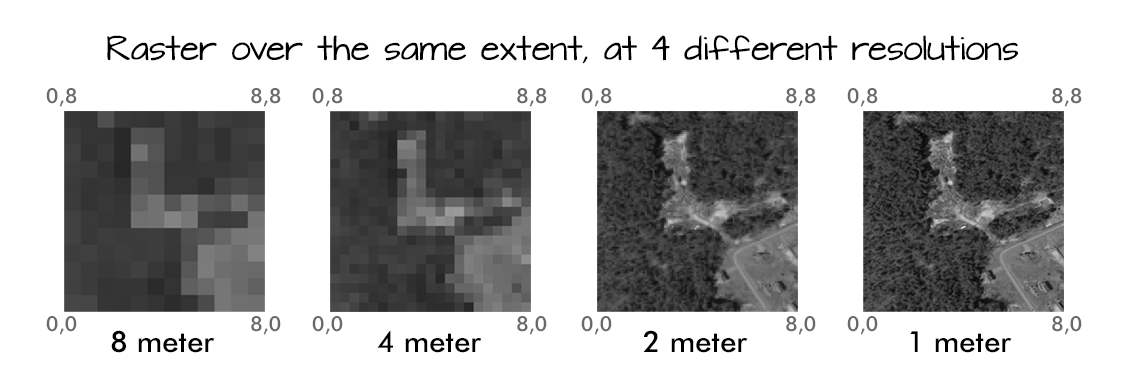
Resolution v. Extent (scale)
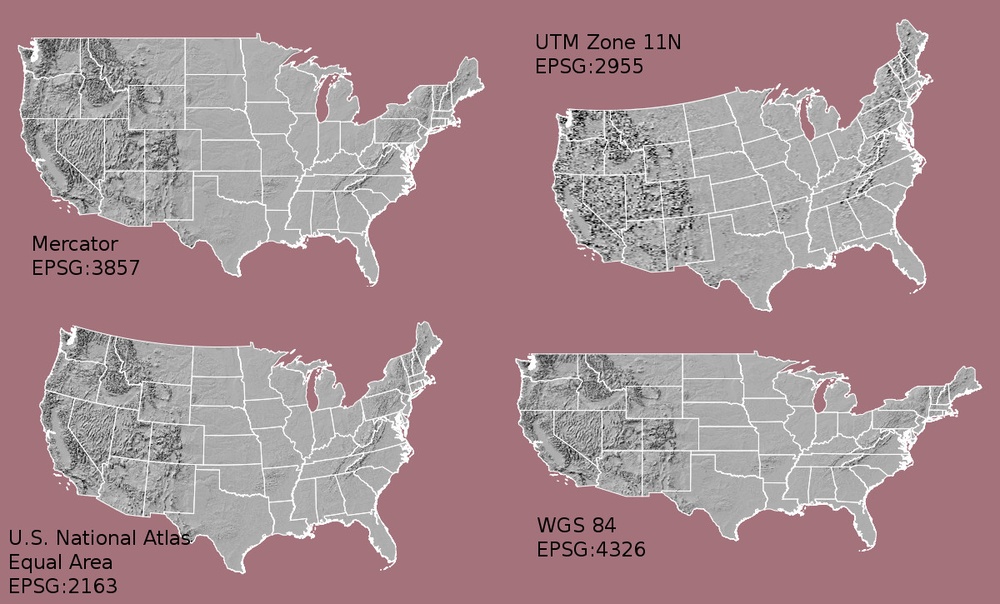
Projections and Coordinate Reference Systems

Projections and Coordinate Reference Systems
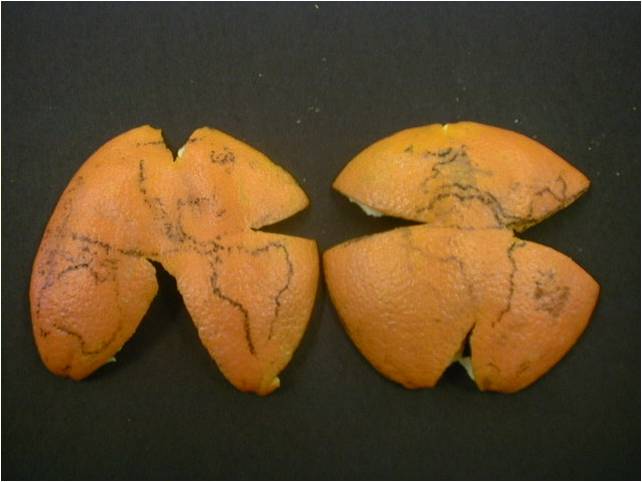
A datum is the choice of fruit to use

A projection is how you peel your orange and then flatten the peel
UTM Zones

You can do a lot with those parameters

See Jason Davies’s Map Projection Transitions - https://www.jasondavies.com/maps/transition/
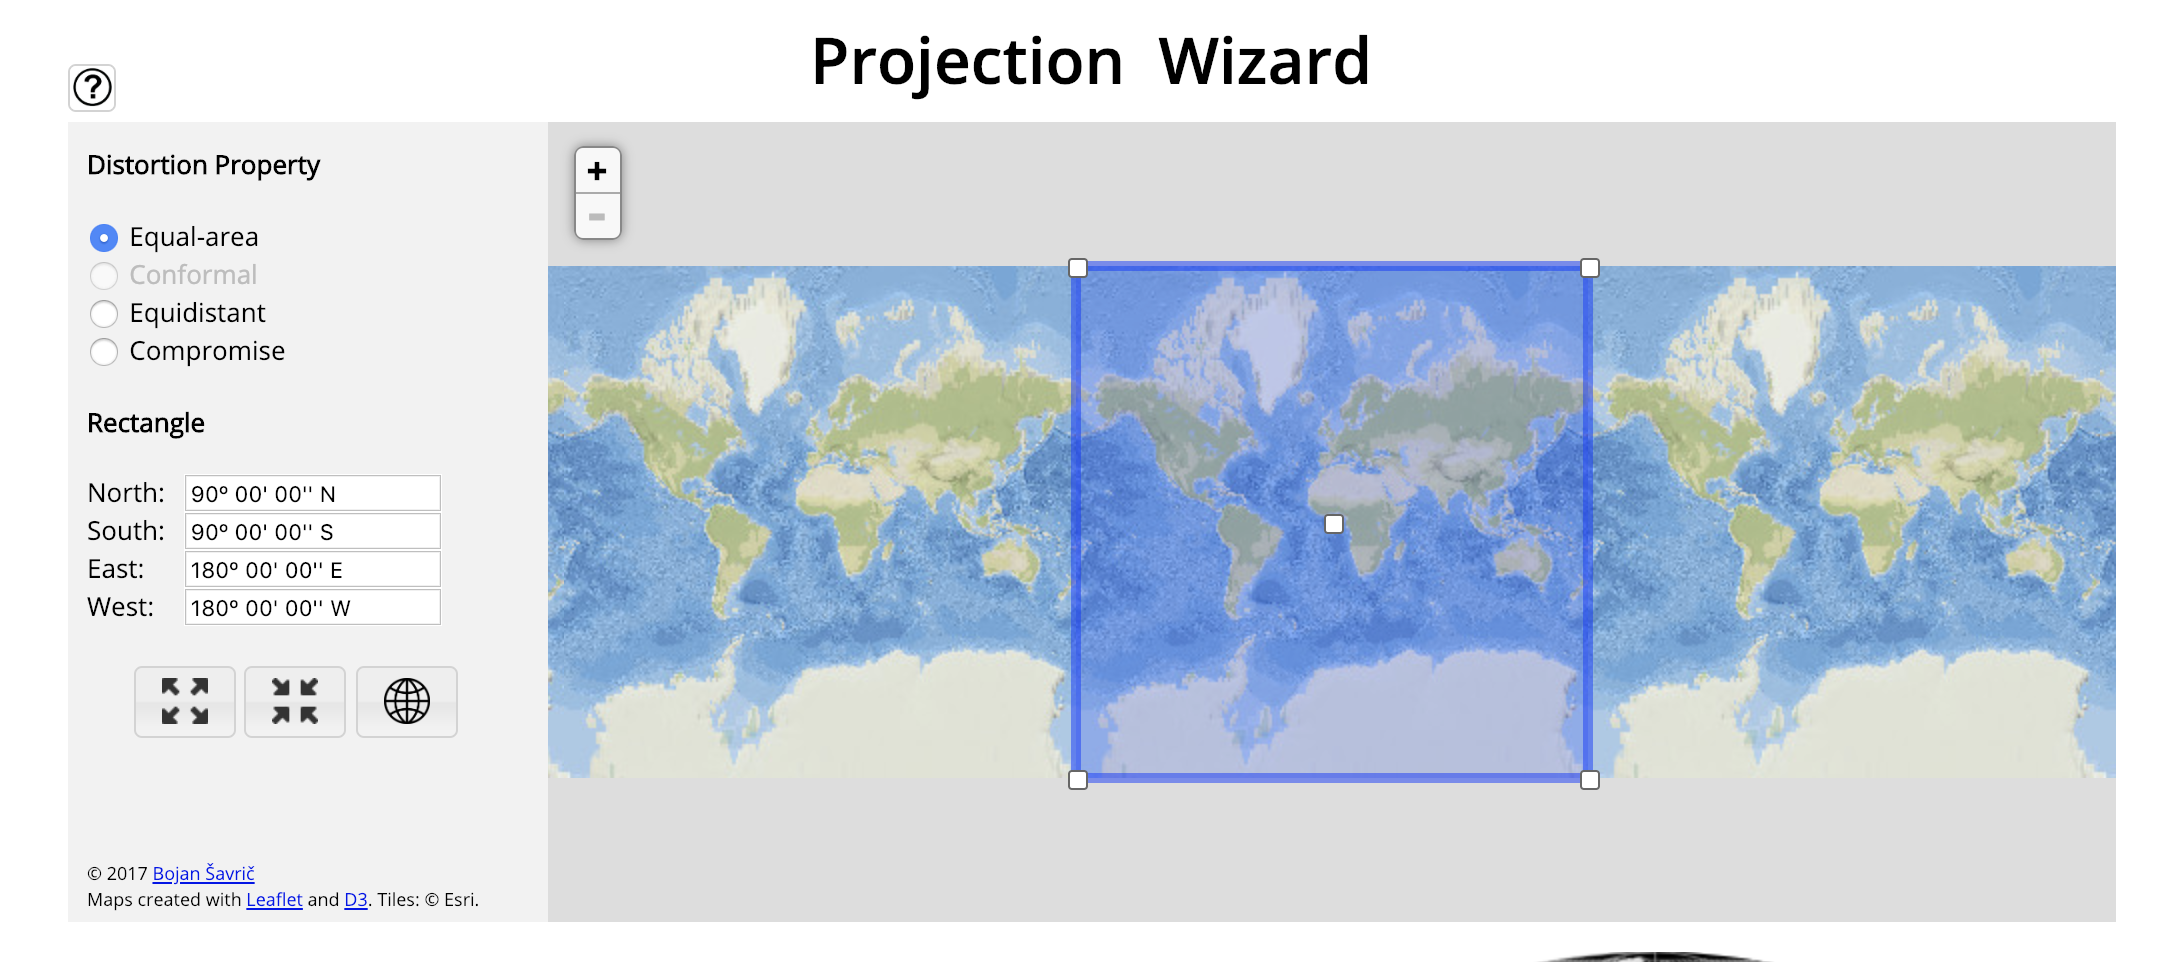
Need help choosing a projection
See http://projectionwizard.org/